

Gold (XAU/USD) eyes deeper losses, as the rally in the US Treasury yields picks up pace in European trading.
Despite closing Wednesday above the $1800 level, the bears retain control amid a technical break to the downside on the hourly chart.
The price of Gold confirmed a symmetrical triangle breakdown on the said timeframe after delivering an hourly close below the rising trendline support at $1796.
The bearish break calls for a retest of Wednesday’s low at $1784, below which the measured target at $1770 could be challenged.
The downside bias also got additional credence after the price breached the critical cushion around $1798, where the 200, 100 and 21-hourly moving averages (HMA) converge.
Gold Price Chart: Hourly
(Click on image to enlarge)
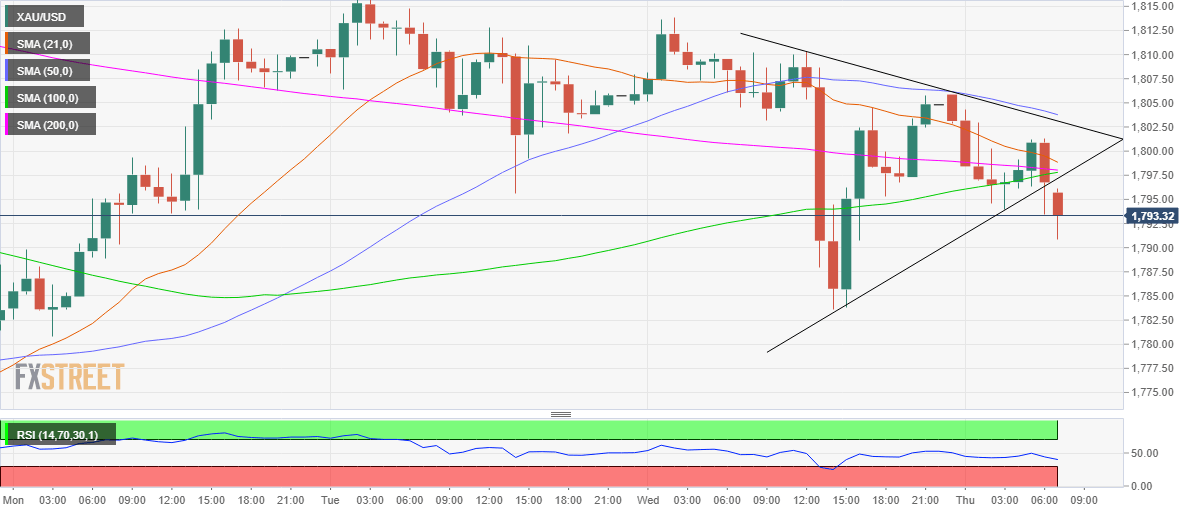
On the flip side, any pullbacks could meet stiff resistance at the aforementioned fierce support now upside barrier at $1797/98.
Further up, the $1800 level could be probed. The intersection of the 50-HMA, pattern resistance and the previous month low at $1803 would be a tough nut to crack for the XAU bulls.
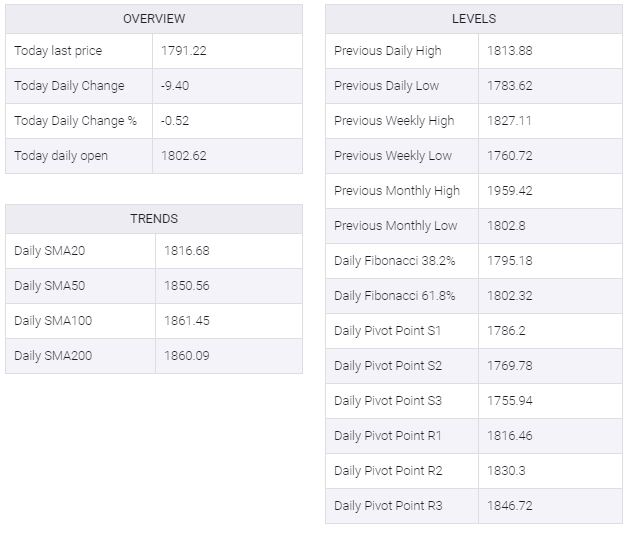
Gold Additional levels
XAU/USD



Comments
Log in or sign up to join the conversation.