

The gold price analysis suggests a mildly bullish scenario amid slightly deteriorated risk sentiment because of the Chinese Evergrande crisis. However, as European traders prepare for Thursday, gold drops 0.06% on the day from its weekly high.
Initially, yellow metals supported the decline in the US dollar and reached a three-day high, and benefited from the bullish chart formation. Recent catalysts have, however, put the gold market to the test.

Image Source: Pixabay
The weakness of the US dollar the previous day was attributed to strengthening stocks and hopes of an economic recovery in the US. However, despite the Fed stopping its chatter to Randall Quarles and Loretta Mester, the absence of new catalytic converters could not reverse the dollar bulls’ gains.
However, the recent controversy over China’s Evergrande and the tight housing market in Beijing has put a smile on gold buyers’ faces.
Despite a seven-day downtrend to a new three-week low of around 93.50 (93.60 at press time), the US Dollar Index (DXY) benefits from market sentiment consolidation. The yield on 10-year US Treasury bonds declines after rebounding from a five-month high that recently rose 1.8 basis points to 1.65%.
The US employment and activity risk factors and background data may keep gold traders alert ahead of Friday’s preliminary PMI data. However, despite stronger US data and concerns about inflation, gold prices will remain in a bearish consolidation mode for the time being.
Gold Price Technical Analysis: Supported By Key SMAs
(Click on image to enlarge)
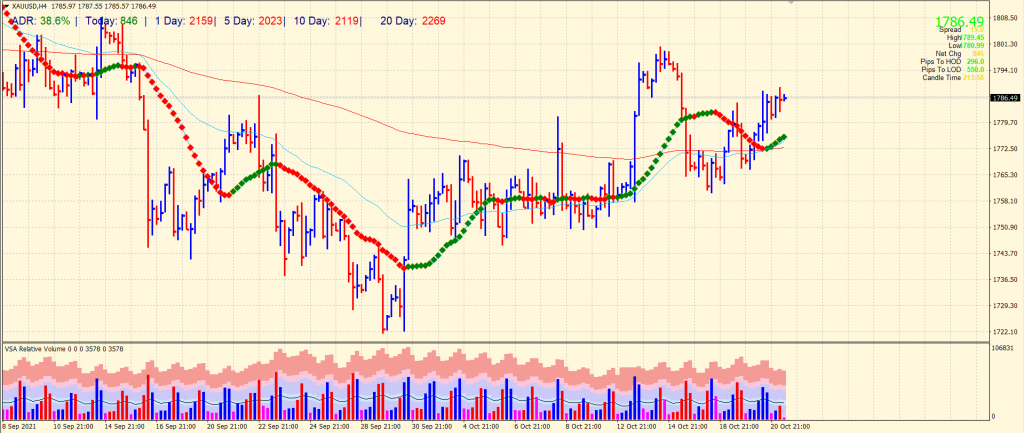
The gold prices remain supported above the key SMAs on the 4-hour chart. Moreover, the bullish crossover of 50-period and 200-period SMAs indicates that the metal can break the previous day’s highs of $1,789 and look to test the $1,800 psychological mark. On the flip side, any move below the $1,780 area will trigger further selling towards the SMAs congestion area around $1,770-76.
So far, the average daily range is 38% which is slightly low. However, we cannot rule out the coming-up volatility in the European and US sessions. On the other hand, volume data is neutral; hence, it is prudent to wait for a breakout before entering the market.



Comments
Log in or sign up to join the conversation.