

Gold price touched $ 1,833, after which it fell $10 even though the US Treasuries rose in value, which led to a decrease in the yields on 10-year bonds to 1.32% per annum.
According to the core CPI, consumer price inflation last month peaked in 3 decades at 4.6%.

Image Source: Pixabay
“These strong numbers are backed by a fairly narrow range of factors,” said Fed Chair Jerome Powell, defending the Fed’s zero-rate policy and massive quantitative easing from a string of heated comments from Republicans and Democrats.
The market is much less afraid of a rate hike. The yield curve and price movement imply there is no tantrum (quite the opposite).
However, against this background, physical demand/support has been lowered from tailwind to neutral, given that the price has risen by $50 since the end of June.
The price of gold in China rose to a 4-week high of 380 yuan a gram, but a discount to global gold quotes was $2.30 an ounce after the average premium was $3.60 this month.
Indonesia becomes Asia’s new COVID-19 epicentre. However, due to a shortage of vaccines, 70% of the South Korean population, 85% of the Thai population and 95% of the Vietnamese population still expect their first vaccination.
The World Bank said that excluding China, GDP in East Asia and the Pacific will grow by only 4.0% this year. The bank has cut its economic forecasts for the region because it is still far from lifting all restrictions.
Meanwhile, Germany’s Dax stock index lost 0.9%. Spain’s Ibex35 Index also fell sharply as regional governments began reimposing curfews and restrictions against the wave of the COVID-19 Delta strain.
Gold price technical forecast: Sweet spots to eye
The 4-hour chart of gold shows that the up bar with a very high volume above the broken key support of $1816. The following down bars have a very narrow spread with nominal volume. Technically, Gold remains strongly bullish, supported by the key 20-SMA on the chart.
(Click on image to enlarge)
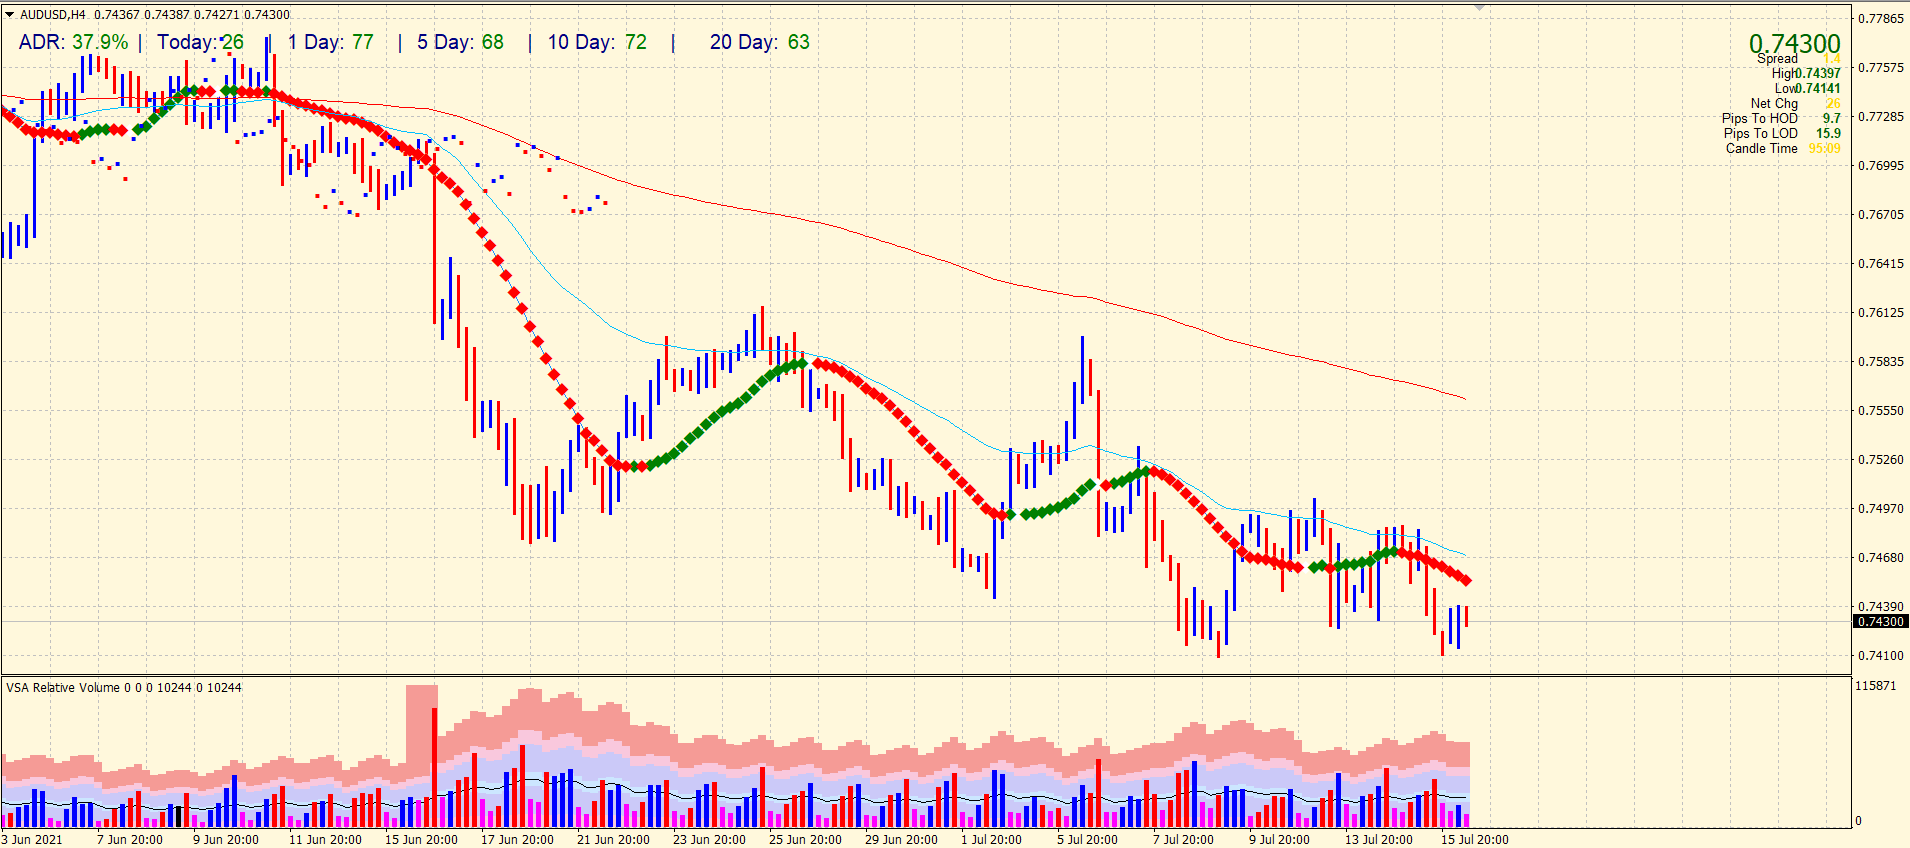
Gold price on 4-hour chart
Gold trading scenario
You can open a long position above $1833 with a stop-loss of around $1816. Alternatively, if the price break below the $1800 level, you can open a short position with a stop-loss of around $1816.



Comments
Log in or sign up to join the conversation.