
The US Treasury Secretary announced this morning a possible 50-year bond. They have injected $2 trillion into the economy, and the situation continues to appear to need even more stimulus. The Treasury appears to be negotiating a second wave of stimulus that could be $2 or $3 trillion. Pretty soon we are going to be looking at $10 or $20 trillion, increasing debt by 30% or more. We were in a fragile environment before the coronavirus crisis. We had double the debt compared to 2008.
According to traders, there was a quadrillion dollars worth of risk in derivatives. They have increased debt and doubled the risk in derivatives to two quadrillion dollars. I have a hard time even saying the word quadrillion. It is hard to understand what they even represent. The central banking system is way too over-leveraged, way beyond where we were in 2008. The more stimulus or liquidity injected into the economy, the more the situation will worsen. We could see damage ripple out across the board in terms of the supply of commodities, goods and even in the transportation sector. Can we even get gold delivered to the London market to meet the paper obligations? We doubt it.
In crude, we are in oversupply since no one is driving now given the lockdowns. The good thing is that the environment is getting a brief relief from all the pollution we create. It is, however, devastating the global economy.
We believe that the current fundamental situation provides great support that precious metals are going to reach all-time highs. Over the short term, we are looking at historic prices to get into the precious metals markets.
(Click on image to enlarge)
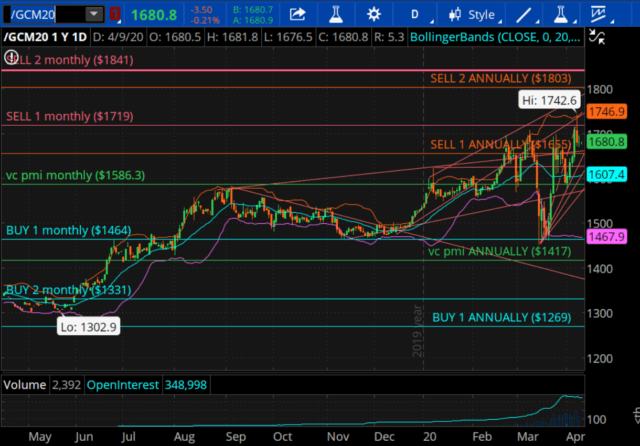
In gold, the market is a seasonal market, which follows wave patterns more than most other markets. The VC PMI identifies supply and demand, but also cycles. The current gold cycle is entering a 180-degree target that points to April 13 as when we can expect a reversion to occur. In looking at the daily codes, we are looking at a head and shoulders bottom, which confirms that the market is moving in the expected direction to the upside.
Putting into perspective the time window, the bullish mode of the VC PMI, the head and shoulders bottom, and the fact that many short-sellers were caught short without physicals, we can see major buying demand coming in, which should lead to a major move up early next week. If it is going to be a top, the ideal price resolution should be a rally into the higher levels of the daily Sell 2 of $1770 and the Sell 2 annual target of $1803.
The daily chart is telling us that this could run up to $1895. If we use the monthly and the yearly average, we are looking at the annual at $1803, which we published last September, and the monthly target at about $1841. If we do get this resolution and a blow-off into April 13, we recommend that you liquidate and take big, big profits at that point. The move down to $1302 on May 19, 2019, to $1803 is a major, major move.
Gold Weekly
(Click on image to enlarge)
Courtesy: TDAmeritrade
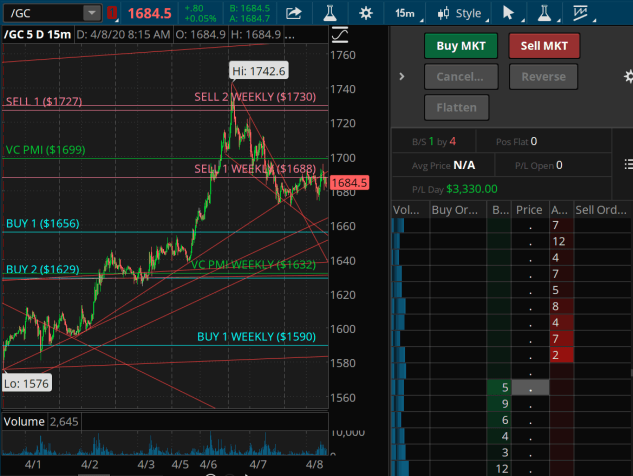
Coming into this week, we recommended that our subscribers sell at $1730 and $1691. We completed the target of $1742.60, which was the high, meeting the weekly Sell 1 and 2 levels. The market is hovering around the Sell 1 level of $1888 and the average price of $1699. What artificial intelligence tells us is that the market is in an area of distribution of supply on the weekly data. A close below $1688 would activate a short trigger on the weekly signal. The fact that the market is trading below the daily average price of $1699 indicates that the trend momentum is bearish. It is a slightly bearish connotation from the daily, while the weekly target has been completed.
We are trying to identify what could be a short signal on the weekly on a close below $1688. The fact that the market came above $1742, means that it came into what is a harmonic alignment or resistance level that is aligned daily and weekly.
We have a bearish trend momentum, which will be negated if the market goes above $1699. For day traders, gold is in the neutral zone. For swing traders, a close below $1688 would activate a potential short trigger with a target of $1656 to $1632. Your stop would be a dollar stop above or carry the position to the end of the day. Do not use straight stops.
If gold closes below $1688, we could see a reversion back down, so it is an ambiguous area. If we close below $1715, it would be a short trigger. If it closes above $1699, it would reactivate the bullish trend momentum.
We are getting a short signal and recommend $1688 to cover longs. Then we are reverting to shorts on a close below $1688. We are waiting for more confirmation to add to our position. The VC PMI is identifying a short-term short signal, which does not change the long-term view.
Monthly and Yearly VC PMI Reports
(Click on image to enlarge)
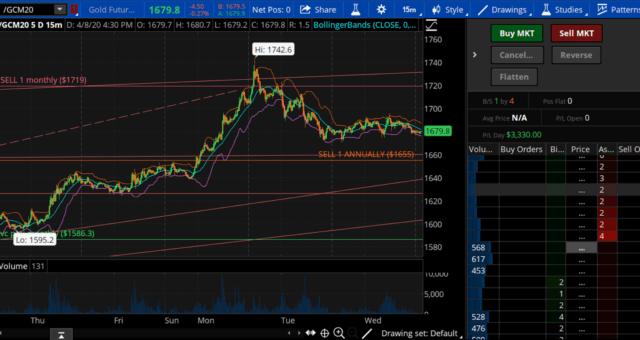
The monthly told us to take profits at $1719 when the market was in the mid-$1650s. After the market traded above the mean on April 1, 2020, it activated a bullish trend momentum into the expected target of $1655. We have a target of $1719, as well. It met the annual target of $1655 and the upper end of the target of $1719. We published this recommendation on April 1. This is related to the futures contracts, not derivatives, options or stocks. The monthly target was $1719, the weekly target was $1730, both of which were met. It also met the daily at $1727.
We are getting $20 and $30 moves, which used to be very rare. Now we are getting $100, $200 moves in a day, so you need to re-calibrate your risk and how you trade. Given the volatility, trading 10 contracts before is like trading 50 contracts today.
Silver
(Click on image to enlarge)
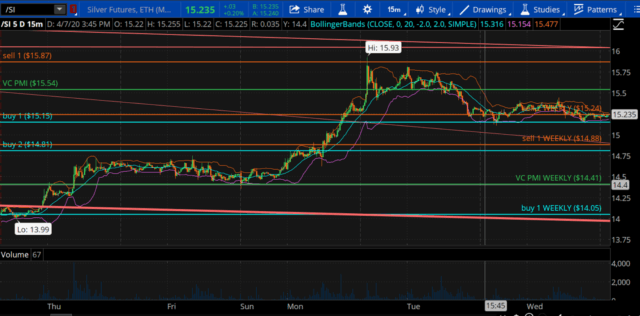
Silver came in with a Sell 1 level of $15.87. It provided a great opportunity to lock in profits. The market then reverted back down to the mean and the extreme below the mean. We are in an area of support on the daily with a Buy 1 level of $15.50. We seem to be in an area of distribution at the Sell 2 level on the weekly. This is a mixed signal. If it comes down to $15, it’s a buy signal on the daily. Trading above $15.24, has activated a bullish signal. Trading above the Sell 2 level, even though the market goes up, is a high probability risk with a 95% probability that the market could revert from here. Wait for the market to come down to $15.15 and activate a buy signal on the daily, come up again to $15.24 and meet the target of $15.54, which is the weekly average price.
Gold and silver are trading pretty much similarly, but silver has been lagging gold a bit. The patterns are very similar in terms of the level of demand. Both are in a mixed picture, with the market breaking out of the Sell 2 into an area of distribution of supply. So far, the high that we made on March 24 of $18.87 is the target to challenge to move higher.
We are seeing a head and shoulder bottom formation. This is a pattern that seems to be unfolding in gold and silver. Even on the E-mini S&P we are seeing the same pattern. It is a powerful configuration that identifies the market’s path of least resistance. Once it broke the neck of this head and shoulder bottom, it confirmed the bottom and the market may test new highs. This is a very bullish pattern.
My target for day trading is to make $300 per day, per contract, without affecting any of my long-term positions. We are long gold in stocks and derivatives. We are looking to add to our long-term position.
In silver we are near to activating a short signal. But I want to be cautious on taking short triggers since the market appears to be ready to break out to the upside. We may get some swing moves down, the path of least resistance is for the market to move higher to complete the pattern that appears to be building from the head and shoulders pattern to $18.36 for gold.
E-mini S&P
(Click on image to enlarge)

The E-mini is trading above the daily average price, so it has been trading around that price for a while. The VC PMI’s artificial intelligence tells you to stay neutral when a market is trading around the daily, weekly or monthly average price. It could go either way; 50/50 up or down. We want to trade the highest probabilities, which is if the market goes up to the Sell 1 or 2 or down to the Buy 1 or 2 levels.
Crude Oil
(Click on image to enlarge)
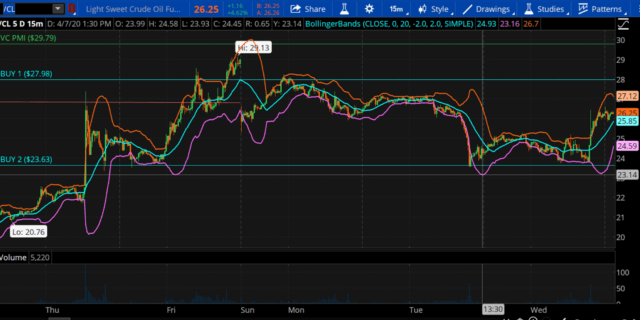
The weekly VC PMI signal is activating a buy signal. If you don’t have a position and you are waiting for a signal, wait for the market to come down to the trigger level; in this case the weekly Buy 2 of $23.63. The first time it touches is a trade alert. If the price closes above that level on the next 15-minute bar, it is a buy signal. Then you go long from $23.63 with a stop at $23.63 and your target is $27.98. Crude rallied and you can trail or raise your stop as the market rises. It is trading between the Buy 1 and Buy 2 level. This is an area of accumulation.
GDX
(Click on image to enlarge)
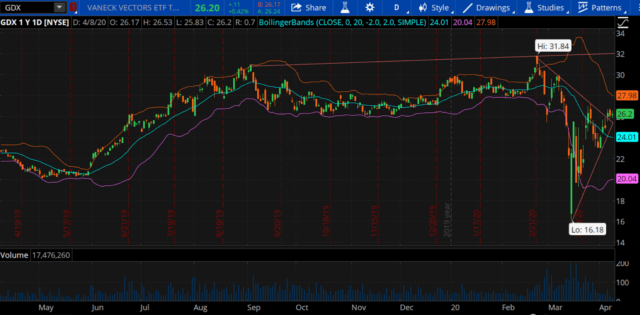
We are beginning to see reversions from this level and we are taking a cautious position on the long side. We are using ETFs and stocks to maintain a position without a margin call risk. We use the futures contract to activate opportunities. We manage the risk away from the futures contracts by using stocks, ETFs or indices, such as the GDX, which follows the price of gold. On April 1 it was at 22.96. The GDX index at the high yesterday was 26.96. That is a pretty decent return in a matter of days; about 10% in six days. There is no margin risk. If the price collapses, as it did, you simply will be affected by the market volatility.
GDX was at 31.84 on February 24. It dropped about 50%. It broke the previous lows of May 2019, which was the start of gold’s leg up. When you see this kind of formation, which can feel like the end of the world, creates historic opportunities, particularly in gold mining shares. We have lost in excess of $20 trillion at the low in the equity markets. According to sources we know in mining, they anticipate that the earnings reports in April are going to show that gold mining companies will be the only companies that made money during this quarter. We are going to see a fundamental shift in buying psychology, which is beginning to recognize that gold should be priced at much higher levels, not just as a commodity, but also as a currency. We expect to see a great deal of the volume come back into gold mining shares.
To learn more about how the VC PMI works and receive weekly reports on the E-mini, gold, and silver, check out our Marketplace service, Mean Reversion Trading.


Comments
Log in or sign up to join the conversation.