

Gold attracts some dip-buyers on Friday, stalling the previous day’s retracement slide.
Geopolitical risks, inflation fears and Fed hike bets underpin the USD, capping gains.
Traders might opt to wait for the crucial US NFP report before placing directional bets.

Gold (XAU/USD) touches a fresh daily high during the first half of the European session on Friday, with bulls making a fresh attempt to build on the momentum further beyond the $4,300 mark. The commodity remains on track to register its best week since January as traders now look to the crucial US monthly employment data for fresh impetus amid mixed signals over the US-Iran peace deal.
US President Donald Trump told reporters on Thursday that he believed the war with Iran would be over soon. However, a Saudi official said that some Iraqi militia factions, in coordination with Yemen's Iran-backed Houthis, are planning to attack the kingdom in the very near future. This raises the risk of a wider regional conflict and prompts traders to price in the geopolitical risk premium, which is seen acting as a tailwind for the safe-haven US Dollar (USD) and might cap gains for Gold.
Meanwhile, reports suggest that Iran is reviewing a framework agreement over the management of the Strait of Hormuz that would prohibit passage of US, Israeli, and hostile vessels until compensation was paid. This, in turn, dampens hopes for a diplomatic resolution to end the five-month-old US-Iran war. Moreover, Houthis claimed responsibility for an attack on a Saudi oil tanker in the Gulf of Aden, reviving concerns about energy supply disruptions, supporting oil prices and fueling inflation fears.
This might force global central banks, including the US Federal Reserve (Fed), to adopt a more hawkish stance, which should contribute to keeping a lid on the non-yielding Gold. According to CME Group's FedWatch Tool, traders are still pricing in an over 80% chance that the US central bank will raise borrowing costs by the end of this year. This favors the USD bulls and warrants some caution before positioning for the resumption of the XAU/USD pair's recent recovery from the $4,000 psychological mark.
Moreover, traders seem hesitant to place fresh directional bets and might opt to wait for the release of the closely-watched US Nonfarm Payrolls (NFP) report. The key labor market data will influence market expectations about the Fed's future policy path and drive USD demand, which, in turn, should provide meaningful impetus to Gold. Meanwhile, China's central bank reported its official gold reserves reached $306.35 billion at the end of July, increasing from $303.72 billion at the end of June.
Analysts at OCBC note that “near-term momentum has improved,” with the upcoming US payrolls report now seen as “key to whether the decline in yields, USD and gold’s breakout can be sustained.” They point out that gold was “last seen at $4,247 levels,” with “daily momentum is mildly bullish while RSI rose to near overbought conditions.” On the technical front, OCBC highlights “resistance at $4,333 (23.6% fibo retracement of 2026 high to low), $4,393 (100 DMA)” and “support at $4,160 (50 DMA), $4,077 (21 DMA),” suggesting a constructive bias while acknowledging that the sustainability of the recent move will hinge on the tone of US data.
XAU/USD daily chart
Technical Analysis: Gold's bullish technical setup backs the case for additional gains
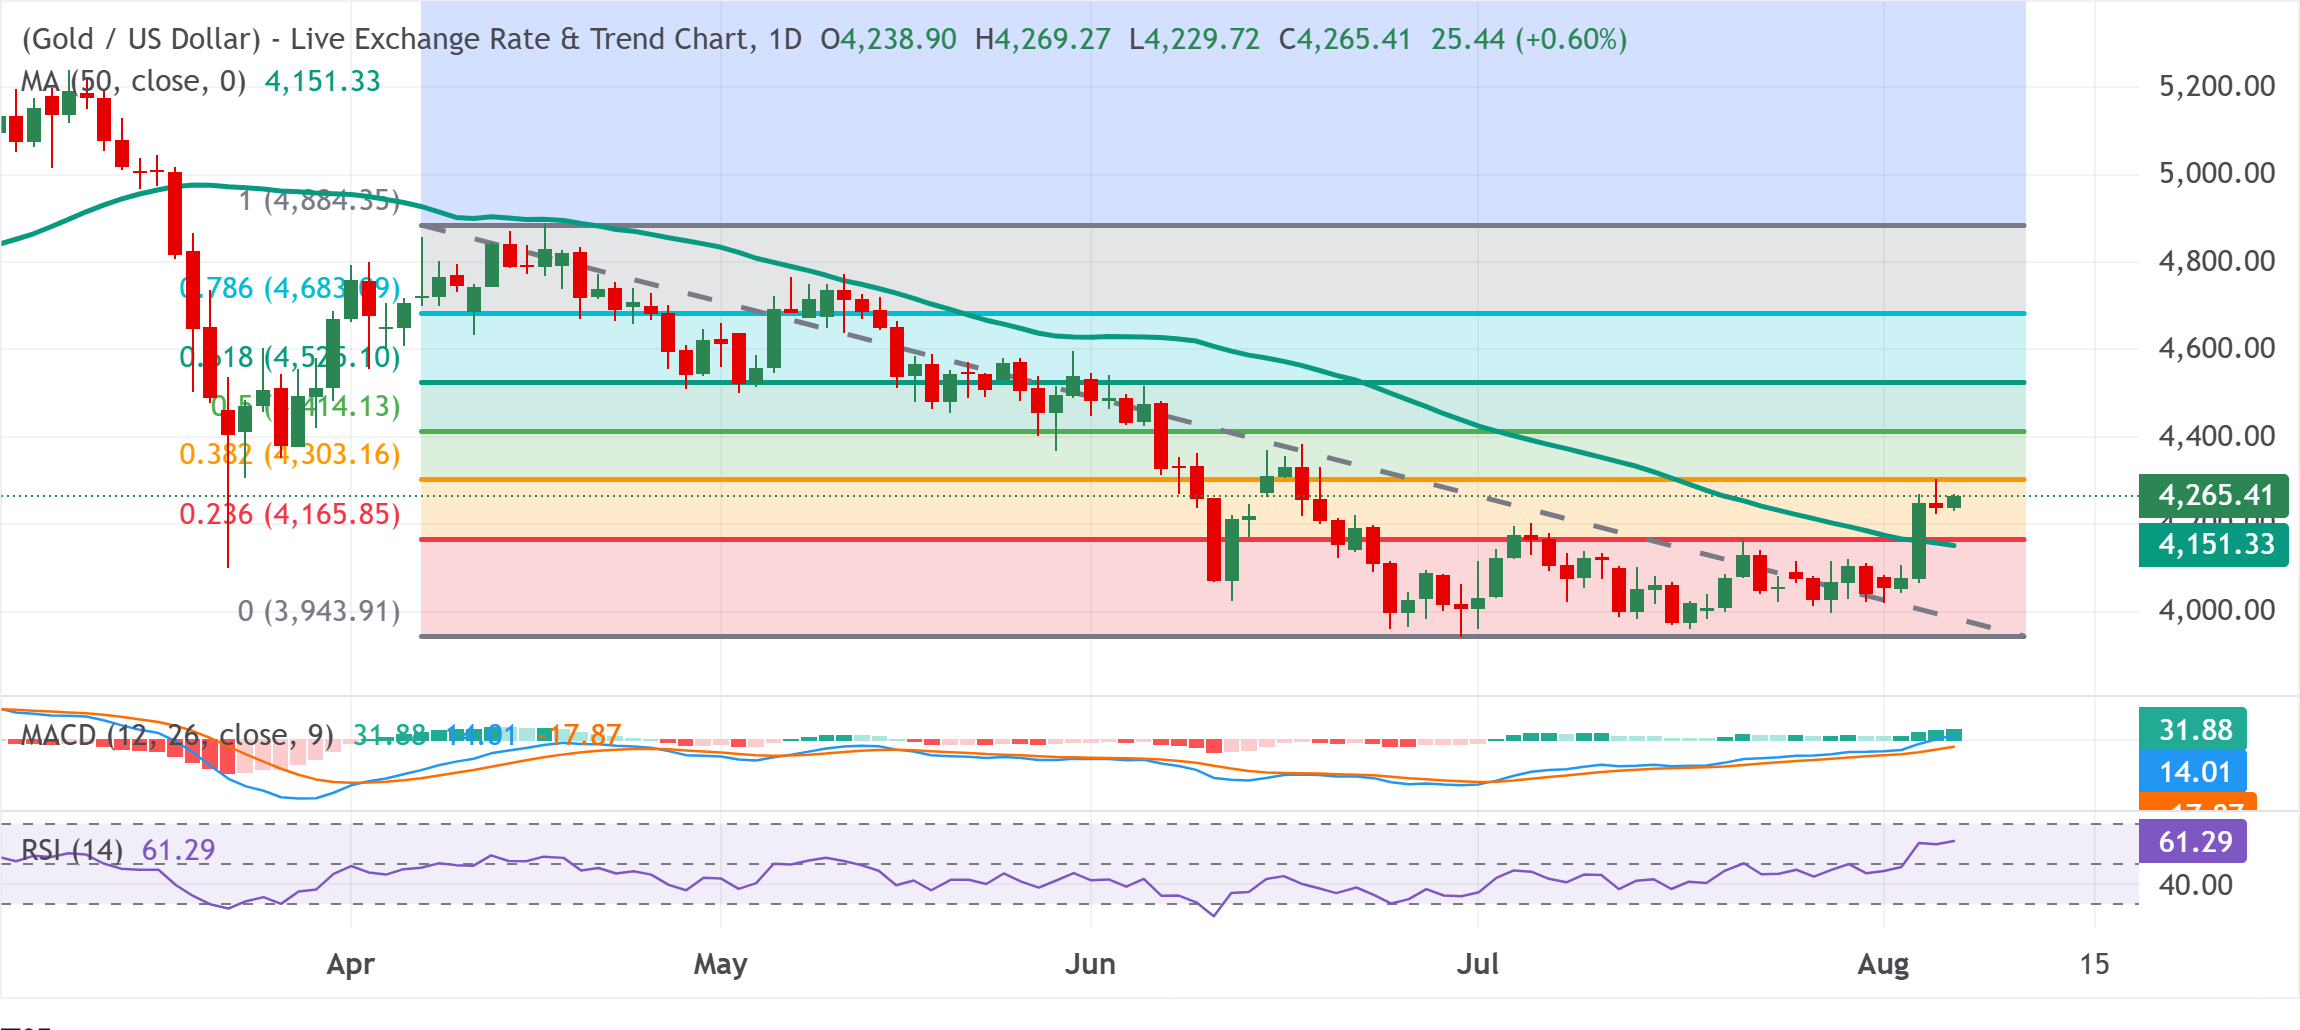
This week's breakout through the $4,165 confluence – comprising the 23.6% Fibonacci retracement level of the April-June slide and the 50-day Simple Moving Average (SMA) – was seen as a key trigger for bullish traders. Momentum indicators also align with this constructive tone, with the Relative Strength Index (RSI) at 61.29 and the Moving Average Convergence Divergence (MACD) above zero with a positive latest reading. This, in turn, suggests that buying pressure remains in control while the advance faces an emerging overhead hurdle near the 38.2% Fibo. level, around $4,300.
The aforementioned barrier is followed by the 50% retracement at $4,414 and the 61.8% level at $4,525, which together define a broad resistance zone before higher hurdles at $4,683 and $4,884. On the downside, immediate support is located around $4,265, with stronger demand expected at the 23.6% retracement at $4,165 and the 50-day SMA at $4,151. A deeper pullback toward the structural anchor near $3,943 would be needed to challenge the current bullish bias.



Comments
Log in or sign up to join the conversation.