

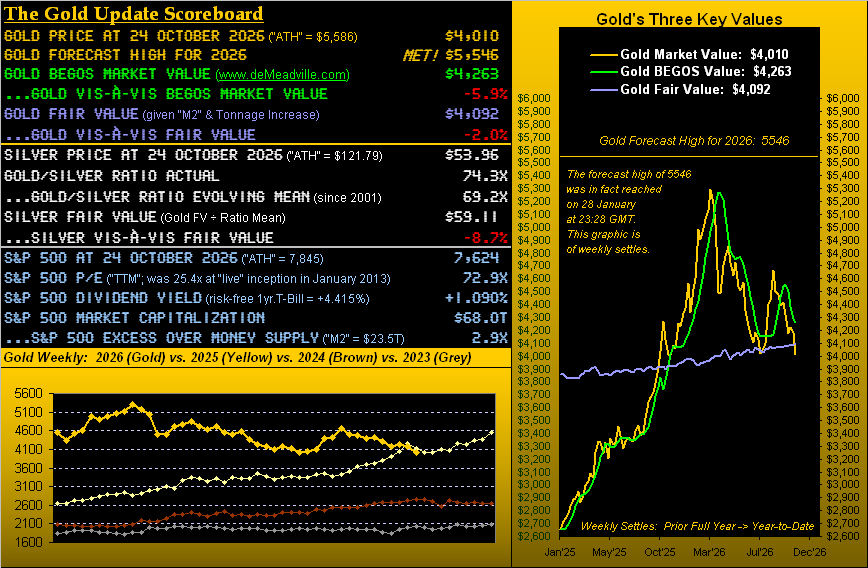
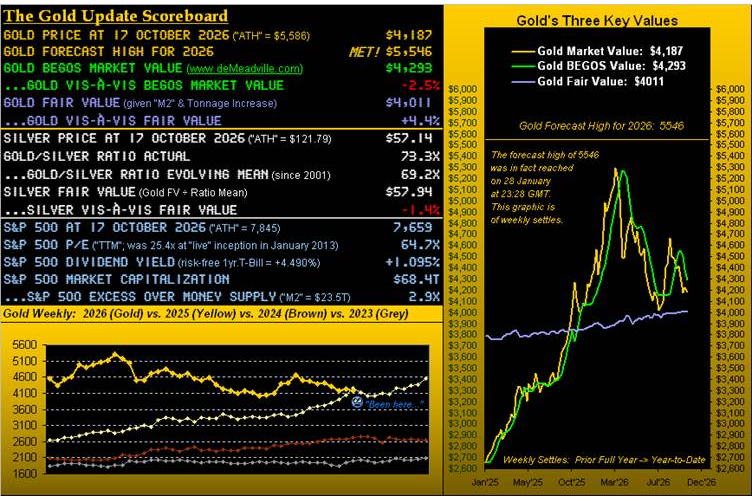
We start with a wee housekeeping note. As depicted in the above Scoreboard, Fair Value for Gold is now 4092, rather than our anticipated level for this week of 4014. This is due to the latest aggregate of Gold tonnage (hat-tip The World Gold Council) being a hair’s breadth shy of our extrapolated amount. And therefore — as those of you scoring at home comprehensively understand — the less there is of something, the more ’tis worth. Hence, the higher Fair Value. ‘Course, the 78-point difference between 4014 and our adjustment to now 4092 is about a single day’s expected trading range. Thus, one might consider said revision as immaterial; however our passionate penchant for precision is perennially paramount.
“Ok, mmb, but what happened with all your recent points about price ‘basing’ instead of going down?”
Hardly was this past week pretty, Squire. With respect to Gold having just hit “The Floor” of 4000, it so did yesterday (Friday) smack on the dot of 02:00 GMT, (we surmise via one of those pre-canned “on the hour” sell programs). Yet straightaway, buyers came to the fore in swiftly hitting the offers straight up to 4028 in a mere 12 minutes, and then further still to 4050. But these value-seeking bulls were unable to hold the score through the balance of the day, price succumbing to as low as 3989 en route to settling the otherwise down week (-4.2%) at 4010. Net-net, ’twas Gold’s third-weakest week of the 42 year-to-date, the weekly red-dotted parabolic Short trend wending its way lower as we here see in our year-over-year view:
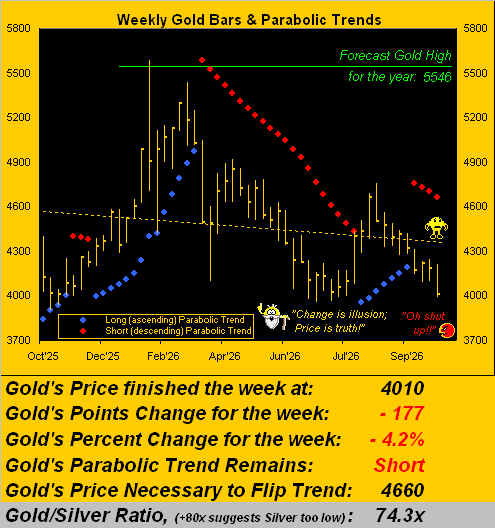
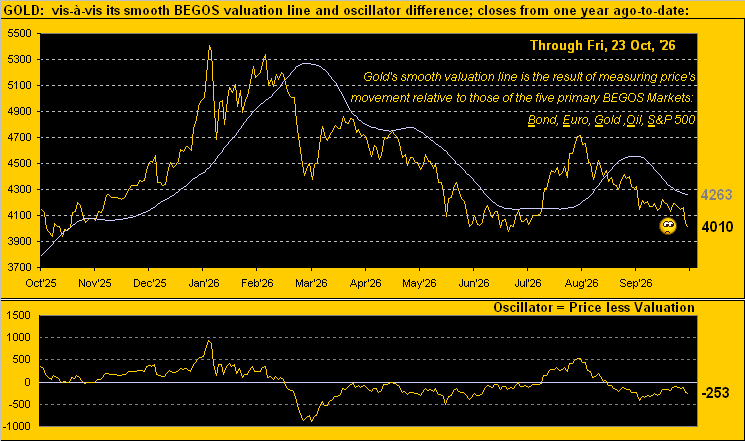
Notwithstanding breaking a bit below the “The Floor”, as you see, Gold’s been there before, as recently during this past July. Yet, as we’ve herein eloquently waxed over these many years: “Change is an Illusion whereas Price is the Truth.” And Gold priced today at 4010 is quite attractive: per the opening Scoreboard, broadly Fair Value is 4092, and from the near-term perspective, our BEGOS Market Value is 4263. The latter is depicted here in our year ago-to-date view:
“But mmb, ya got the war and another Fed hike, huh?”
Squire, we understand that Mike Waltz (U.S. Ambassador to the U.N.) just suggested the USA/IRN conflict may still have a year to go. Too, by our reckoning, next Wednesday (28 October) the Federal Open Market Committee must certainly vote to again raise their Bank’s funds rate. Inflation by its various measures is running at least double the Fed’s targeted 2% pace, as further shall be reflected come next Thursday’s (post-FOMC) release of the “Fed-favoured” Personal Consumption Expenditures for September.
“So you really think the Fed’ll definitely raise, mmb?”
‘Tis a good query, Squire. The “consensus” (for what ’tis worth) is that the FOMC this time ’round sits on its hands. However, we instead say “certainly to raise” merely because rather than engage in the modern-day motif of parroting, we actually abide by the math, which has the words “must raise” written all over it. If we’re wrong, no worries: the FOMC can always vote for a “double raise” at its 09 December meeting, just in time for the holidays. Indeed, there’ve been like occurrences under Chairs Powell, Greenspan and Volcker. And how’s that inflating price of Oil workin’ out for ya? On this side of The Pond, our last petrol fill-up ran the U.S. equivalent of $10.33/gallon.
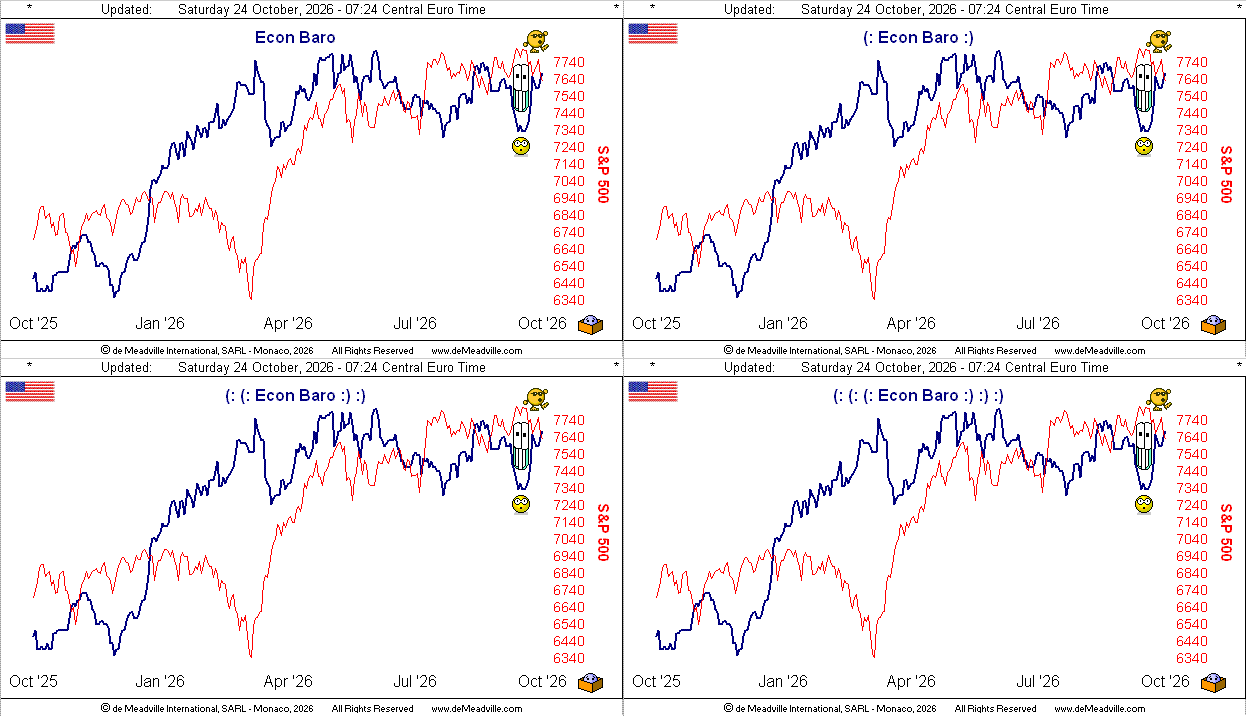
As to weathering it all by the Economic Barometer, there’s been net resiliency of late, even as little data arrived during this past week. Therein however, the housing biz is having a bit of a skid, September’s Pending Home Sales having slipped the most year-to-date. ‘Course, since the depths of COVID, StateSide mortgage rates nearly have tripled. Has too your paycheck? Not to worry, for marked-to-market, you’re still a millionaire, the S&P 500 today 3.5x its COVID low, sporting a price/earnings ratio (ex-CRWD) of 46.9x and spritely yield of 1.090%. Here’s the whole picture, boxed in as it appears:
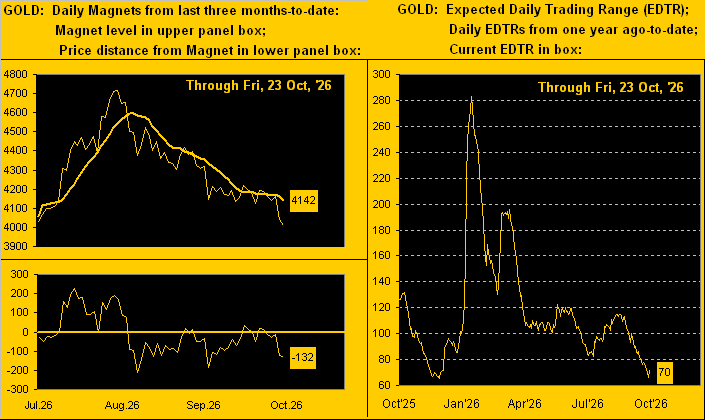
As to the nature of how Gold is trading these days, let’s look at this two-panel graphic (as sourced from the website’s Gold page). At left is Gold’s path from three months ago-to-date astride its Market Magnet, (now at 4142 vs. price at 4010). Penetration of the Magnet suggests near-term continuance of price in the same direction, but only to an extreme whereby price is then attracted back to the Magnet as we see occurred twice during September from points’ deviations of respectively -211 and -186, (the current being -132 as labeled). At right from a year ago-to-date is Gold’s EDTR, i.e. “expected daily trading range”. (Again we remind you WestPalmBeachers down there, this is not price direction). And as labeled, our EDTR for Monday is 70 points, such narrowness not seen in nearly a year. This suggests the market is more balanced than outright plunging, in turn giving “The Floor” a fighting chance to hold:
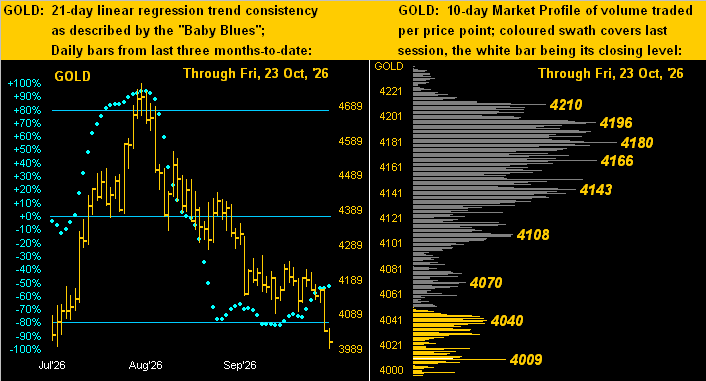
Then too we’ve our two-panel display of Gold’s daily bars on the left across the past three months with their baby blue dots of regression trend consistency, the Long signal from 09 October, (price then 4220) exceptionally failing, albeit “The Floor” of 4000 may be maintained such that price can move upward. But as is clearly obvious in the 10-day Market Profile on the right, there is substantive volume-dominant resistance right up through the 4100s. Yet, if Gold can run that “gap” from here up to at least 4108, it could be convincing enough that “The Floor” shall be considered as having held such as to bring in more buying. Quel drame, mes amis:
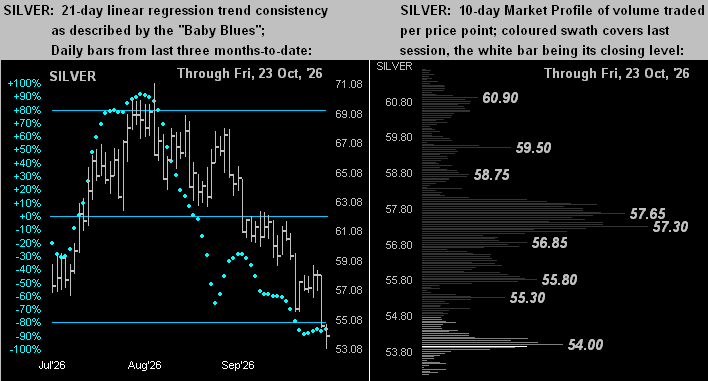
But then there’s poor ol’ Sister Silver, whom relative to Gold is finding her straits more dire by the day. From a Gold/Silver ratio of 65.0x just a month back on 22 September, today’s 74.3x is the highest reading since 28 November a year ago, from which en route toward year-end found Silver gain — in barely one month — as much as +44.8% by 29 December. For when she goes, she really goes! ‘Course, that works bidirectionally, the like graphic to Gold looking anything but bold: her “Baby Blues” (below left) have yet to eclipse above the key -80% axis, whilst by her Profile (below right) today at a lowly 53.96, the overhead 57s appear as stark resistance … at least for the present. But again, she can move quite quickly, her EDTR going into next week now 2.05 points per day. All of which — relative to Gold — Sweet Sister Silver is every so attractive down here:
But hardly attractive is our closing graphic, as we’ve this from the “Strong Stomach Required Dept.”
What essentially by quantity and shape weighs the same as Gold?
“Tungsten, mmb.”
Well, that’s correct Squire as certainly many of our great and good readers know; (the comparative density of Gold being 19.25 g/cm³ and for Tungsten 19.30 g/cm³).
However, their respective pricing is wildly different: one ounce of Gold today is $4,010 whereas one ounce of Tungsten (averaged) is $5.85. And similar to the heartbreak of psoriasis is the anguishing realization of discovering your Gold-coated bar is otherwise comprehensively Tungsten-filled. To wit, this faux Lady Fortuna torn open such as to reveal her innards:
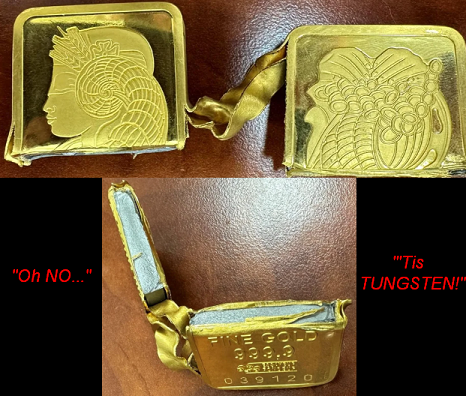
Gut-wrenching sacriledge, that. And yet, why are we going on about it? Courtesy of Bloomy: “CME Group plans to launch tungsten futures early in the first quarter of 2027″. Reprise Murray Head from back in ’75:
“Say it ain’t so, Joe…”
However, we can resolve this on a happy note: Gold futures contracts are settled physically; those for Tungsten shall be cash-settled, thus hopefully there shan’t be any of it physically about for covert co-mingling shenanigans. Regardless, if taking delivery of Gold, ’tis always a good idea to have your pocket-sized fluoroscope, spectrometer or ultrasonic device handy … just to be sure. Perhaps there’ll even be an app for that.
Meanwhile into the new week, the basing battle for “The Floor” of Gold 4000 continues. Structurally, as long as the 3900s continue to hold, we’ll then anticipate the next upturn for Gold!
Comments
Log in or sign up to join the conversation.