
Gold Fundamentals
The volatility of the market has allowed us to trade the technical aspects of the market as well as the strong fundamental picture that it is building. It is a perfect storm for the precious metals, especially for gold. The collapse from $1704 to $1450 was a historic collapse. It was precipitated by COVID-19. In the face of all the liquidation across the board of assets, something happened with gold. There was a significant amount of selling pressure, but then gold rose again almost to the Sell 1 level of $1700. That represented a change from being a commodity to making gold a currency. Within a few days, gold had regained all it had lost and reached new highs of $1788 on April 14. It has remained extremely volatile, which has presented historic opportunities for traders.
(Click on image to enlarge)
The Feds are supplying huge amounts of liquidity. Whatever money the Feds are printing is not going to be enough. We don’t even know yet what the overall damage to the economy has been. Which companies are going bankrupt? How many are going to lay off employees and how many are going to be laid off? Figuring it out fundamentally is impossible at this point, so technical analysis is the only way to go. Use the math of the market to guide your trading.
Gold is making highs against almost every other currency, except the US dollar. The dollar has been rallying, but it is depreciating as the gold market rises. All the money came into the dollar as a safe haven in March, which supported the dollar, even though it’s the dirtiest shirt in the laundry. The dollar is the opposite side to gold. Printing so much money is going to propel a high level of inflation down the road. I am preparing for a couple of black swans that look to be on the horizon. What we saw in crude oil was what most people are talking about: deflation. We already had deflation in crude oil and in stocks, which collapsed by a third in a month. If that’s not deflation, I don’t know what is. Production is crippled in many sectors, including in food, precious metals, grains and many other commodities. There is little talk of planting now, which will harm supplies of food in the coming months. We are looking at a world shortage of food over the next few months, if not years or more. I hope all of these crises are short-term, but I fear not. We have to get back to work. We have to get production and planting and harvesting and processing again. Are we going to be able to do that or will the coronavirus keep everything at a standstill? While we try to figure that out, the stock market is challenging new highs. It is not coming down regardless of any new bad news. Any positive news, at all, is going to spark a massive rally in stocks. The amount of money that governments around the world are throwing at this problem will have consequences, one of which will be the collapse of fiat currencies. Gold has intrinsic value. The dollar has no intrinsic value. It is a paper fiat currency backed by trust and faith in the US government. Is that faith going to last long term?
The VC PMI AI For Gold
We use the Variable Changing Price Momentum Indicator (VC PMI) to analyze the markets and to day trade, swing and long-term trade futures, options, stocks, indices or any financial instrument. It provides the mean and two levels above and two levels below based on standard deviations from the mean. It is written in C++ and is available from the TradeStation app store. Trades based on the VC PMI are independently verified on Ticker Tocker. This report was Live at 7 am PST on May 06, 2020 in my LIVE TV Channel.
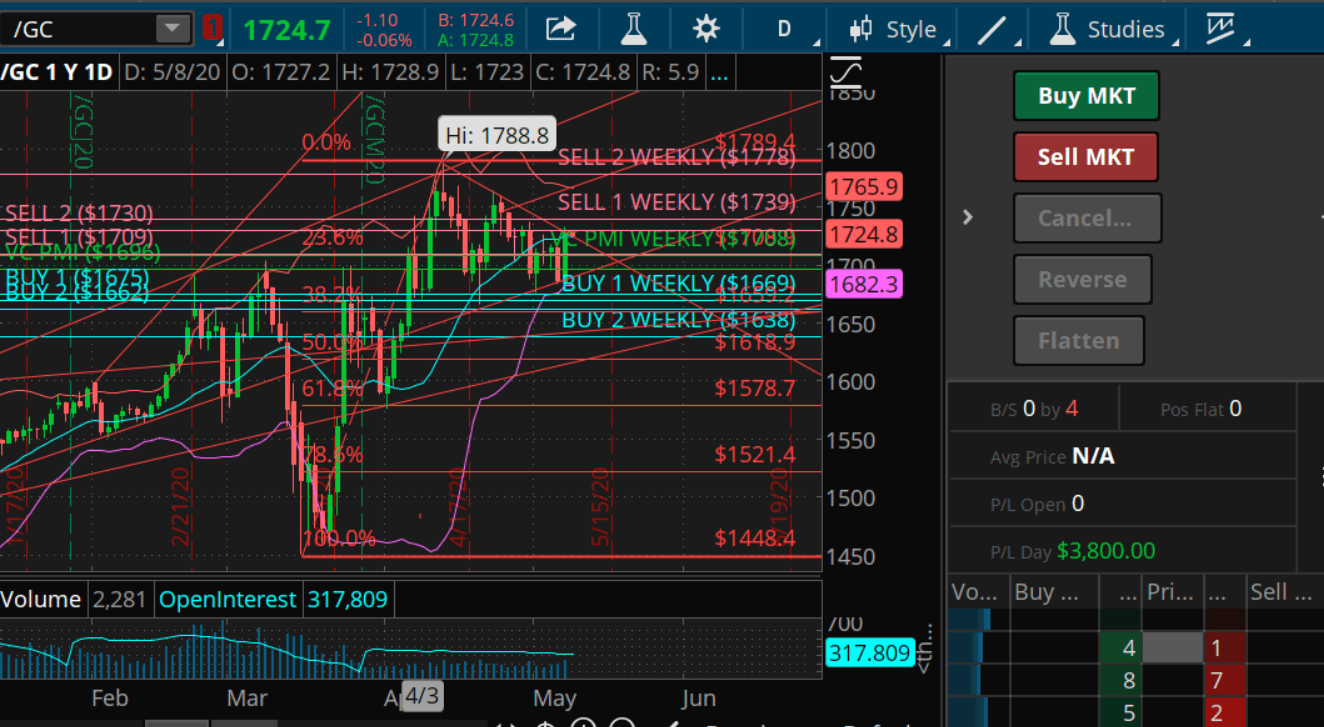
The VC PMI is an automated algorithm that serves as a GPS for your trading. Gold’s weekly average price is $1708. The extreme below the mean, Buy 1, is $1698, and the Buy 2 level was $1686. The extreme level above the mean, Sell 1, is $1720 and the Sell 2 level is $1730.
Gold’s daily average price is $1696. The market is trading around that average. If you are day trading, the average price is a 50/50 standard deviation. The market could go either way, so if you trade around the average price, you are going to be chopped up. The Buy 1 daily is $1675. The daily Buy 2 is $1662. If the market comes down to those levels, there is a 90% (Buy 1) and 95% (Buy 2) probability of buyers entering the market and the price rising back to the mean. We want to wait for the algorithm to show us the highest probability trades.
The market came down to trade below the average, which indicates a bearish price momentum. It then found buyers at higher prices than the algorithm was indicating, at $1687. There was enough buying volume that it negated all the selling pressure this morning. The market then negated the previous bearish price momentum. The VC PMI then went neutral.
The algorithm connects the daily and weekly data, based on the five levels for each set of data. If we get above $1730, it would be a daily breakout and the weekly numbers would then come into play. $1730 is often called resistance or what we call supply or sellers. If the price breaks through that level, it then creates a new setup with five levels.
The weekly average price is $1708. The daily average price is $1696. A close above $1708 would activate the weekly bullish price momentum.
We are in a neutral position right now. Booked $3,800 swing profit. We came into Monday long. We have been buying into $1675 to $1680.
The market appears to be consolidating around $1730. Once it breaks out, it would constitute a daily breakout. The next target would be $1739. If the market reaches that target, take your profit. Don’t wonder if it’s going to go up more. This is a business. Leave your ego and emotions at the door. Use the VC PMI to tell you when to enter the market and when to exit; take your profits and wait for the next high probability trade.
E-mini S&P
(Click on image to enlarge)
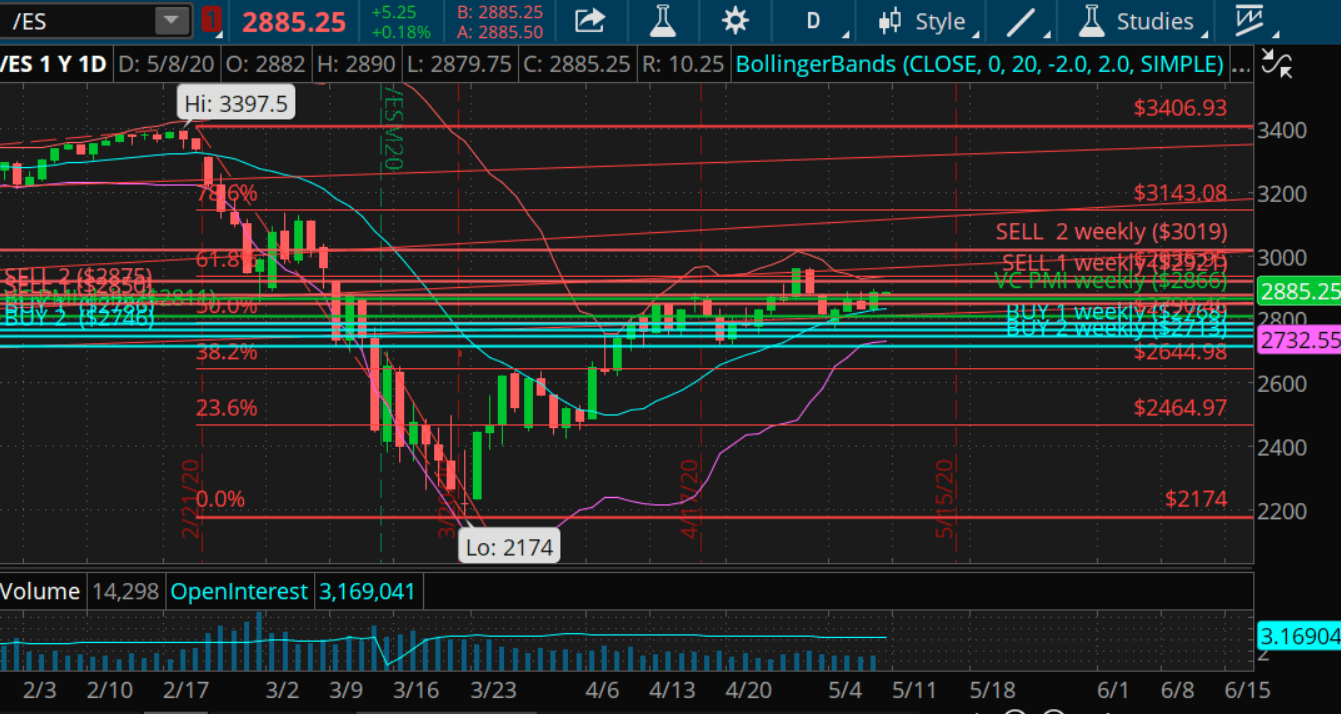
Courtesy: TDAmeritrade
As with gold, there was a massive liquidation that brought the E-mini S&P down to 2174 in March. We lost about $20 trillion in market vlue from the high of 3397 in February. It marked the first time the stock market opened up virtually. Why are the fundamentals so bearish, yet the stock market is going up? Because it is a virtual stock market, a virtual economy. We went from the physical world to a virtual world. The market is saying that the stock market has split from the old system. The data coming out of the old system are all skewed and don’t represent what really happened. The market is now discounting any new bad news. We have another 3.5 million unemployed today, with a total of about 26 million unemployed, yet the stock market is rising.
When the Emini hit 2827, it was a buy signal. 2768 was the weekly buy signal. It met the target and it is going through the sell signals on the daily and weekly signals. It appears that the E-mini will challenge the previous highs and make new highs, in a very short period of time--by September, probably.
Crude Oil
(Click on image to enlarge)
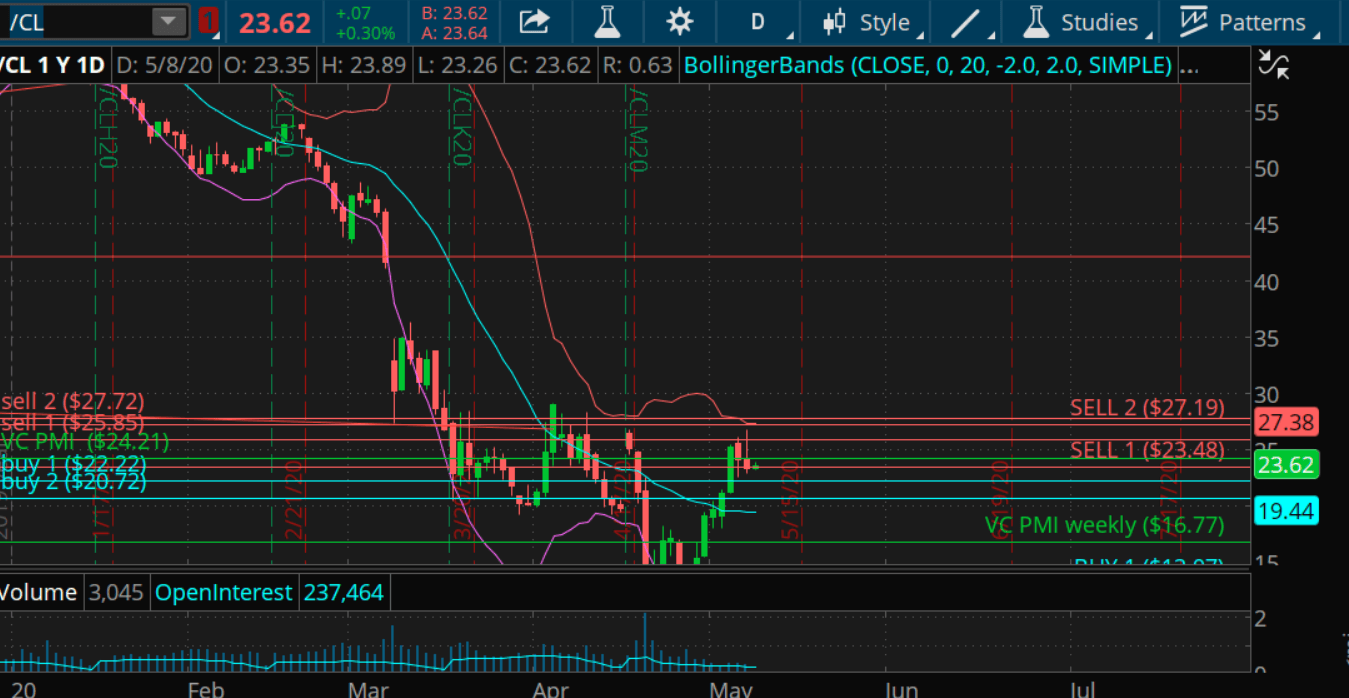
Crude oil made a high of 26.74, close to tripling in price from the lows. If it reaches 30, it would have tripled from the low. The daily Sell 2 level is 27.72. 25.85 is the daily Sell 1 level. The daily average price is 24.21. The Buy 1 is at 22. The daily Buy 2 level is at 20.72. Crude has reached above 25, which activated a short signal, so we are going to go short from 25.66. Your target is 24.21. This is a day trade.


Comments
Log in or sign up to join the conversation.