

The US dollar is slumping, US-China relations are worsening over trade, Chinese aggressive moves in the South China Sea, India's border and against Japan is leading to closing each other's consulates, and the pandemic is still crippling the US economy. All of this is fundamentally good for gold and silver. Using the Variable Changing Price Momentum Indicator (VC PMI), our technical analysis also shows that, technically, gold is ready for a move up with the target of $2,000 now on the table.
Gold Market
- Gold is making a new high $1,900, the highest since 2011.
- The average price daily coming into today was $1,882.
- The Sell 1 level is $1,900.
- The Sell 2 level is $1,916.
- The extreme level below the average price of $1,882 is $1,866.
- The Buy 2 level is $1,847.
(Click on image to enlarge)
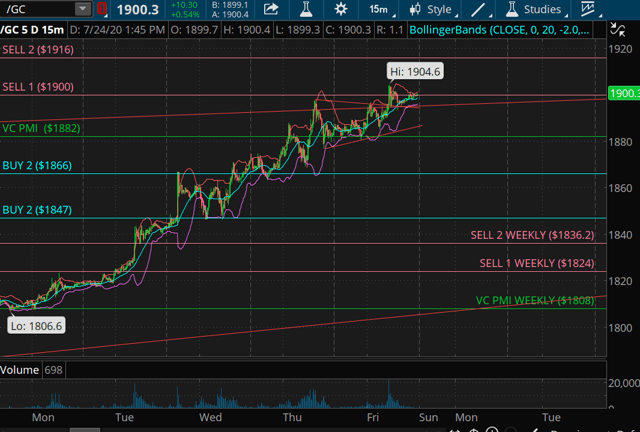
The market was trading last at $1,899, right around the Sell one level based on the data for day traders. The strategy is to identify short triggers on a close below $1,900 using the 15-minute bar. The first time that the price comes down to touch the pivot point, take a profit and go neutral. Once you go neutral, you do not buy above Sell 1 or Sell 2.
The market, even though it's moving up into this price of $1,900, is extremely overbought using conventional technical analysis. The relative strength index for the gold contract is roughly at 77 or 78. Gold and silver, mathematically speaking, are extremely overbought.
The VC PMI stands for the variable changing price momentum indicator and what it does is identify for you a trading range or a structure that you can use when you come into the room to trade. It also allows you to leave your emotions at the door and not follow the herd. There's a lot of emotion in the market right now. The fact that the price of gold reached $1,900 since 2011 is making noise and raising emotions.
It’s taken seven years for gold to come back up above $1,900. It’s been seven years of price manipulation by the central bankers and commercials who usually take the other side of the futures contract. The price since they eliminated the uptick rule in 2012 has been manipulated. Starting in the first quarter of 2013, we began to see massive predator selling which allowed commercial banks and central banks to sell massive quantities of paper contracts that were 10 times the world supply. It has taken trillions of dollars out of the gold market. It skewed the price for many years and was counter-intuitive to the expectation in 2008 that the price was going to go up into the thousands of dollars or even $25,000 an ounce.
For all of the new traders out there, you're going to see a tremendous amount of fundamental commentary about the gold market at $1,900. The reasons are self-evident based on this pandemic crisis that seems to be continuing to take the financial markets and the economy into unknown territory.
These factors could continue to increase the Fed and central banks' balance sheets, since they will probably have to print more money than anybody ever expected, thereby undermining the integrity and intrinsic value of the US dollar. Gold, therefore, should rise as a safe haven and as an alternative currency.
In terms of price, we need to focus on the fact that all we are doing is reaching the levels of 2011. The 2011 levels were the residual effect of what happened in the 2008 Great Recession, when gold dropped from $1,900 in 2011 to $1,050 by July 19, 2015. By August 2018, gold was down to $1,167.
(Click on image to enlarge)
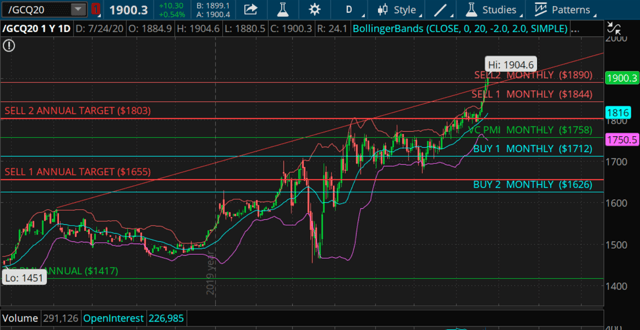
On the longer-term chart, the market reached the upper end of this trendline resistance of $1,900. The price reaching these levels has accomplished the VC PMI's short-term targets. The daily target of the Sell 1 level is now just being completed and the target that is active is $1,916.
A close below $1,900 will activate a short trigger. The close of the 15-minute bar at the end of this bar is the conservative trigger. Automatically when your signal is activated, you can use the pivot level above as your protective stop, so if you went short at $1,899 or $1,900, you can use that $1,900 level as your stop. If it closes above on the close of the next bar, you can liquidate your position and go neutral. The indicators are telling you that even though the price is up here, you're looking at the possibility we can begin to see some kind of supply come into the market. What you see up here now is a tug of war between the supply and demand. The green bars represent demand. The red bars represent the selling that's coming into the market. If you're buying up here even as a day trader, you're buying up into the overbought or the upper end of the extreme level above the mean. It indicates that the probability factor is about 90% to activate a short trigger.
The VC PMI is a contrarian indicator compared to the sentiment of the market. If everybody out there is jumping on board and telling us to buy, such behavior usually comes in at the top of the VC PMI indicator when it's identifying for you a red zone. It is where you pull away from the sentiment of the market, regardless of what is going on right now, and do not buy. The price by the time it reaches this level is discounting whatever fundamentally drove that price up to this level.
We are in an area of resistance or overbought conditions. The algorithm tells you that the highest probability is to sell into this rally. If you're looking for a trade, and if you're coming in as a day trader, this is a way for you to activate the signals systematically, methodically, and mathematically.
If you get a short signal activated for day trading, you can maintain a long-term buy speculating short in the market. It becomes a hedge. If you're long the derivatives underneath and you sell a futures contract, you will be going against that trend and you're hedging; you're short on one but long on another. This is what we do with the Direxion Daily Gold Miners Index Bear 3x Shares ETF (NYSEARCA: DUST).
Silver Market
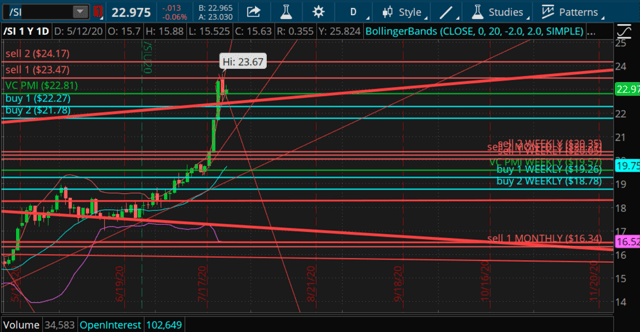
- The silver market has exploded $2.50 over three days
- This has never happened in the history of this market
The Market - changes and opportunities
This market is creating incredible opportunities. There is a risk but you can manage that risk in many ways. I have found that most traders are primarily emotional traders. I was for many years. Even though I started on the floor and saw the technical side of the market, it took me a while to let the market show me where it wanted to go instead of letting emotion drive my trading.
Over the past three or four decades, the markets have changed tremendously, particularly in the way traders analyze the markets. If you were in the markets in the late 70s for example, or right after Nixon lifted the gold standard, there was a lot of fundamental trading. Merrill Lynch was one of the biggest brokers. Unfortunately, they were trading the other side of the market. While they were telling the clients to go short, they were long on the other side. If they were saying to go long, they were usually short on the other side. It turned out to be actually a great contrarian indicator whatever Merrill Lynch spoke - do the opposite.
The fundamentals of the market have changed tremendously because we've gone into a virtual economy or a virtual world due to technology. Since the 1980s or 1990s, the technical revolution exploded, the internet exploded and things became more technical. After all these years, we're beginning to see that algorithms can be applied to trading, if you write the codes.
That's what the VC PMI has done. It’s called the Variable Changing Price Momentum Indicator because it is a variable indicator that adjusts depending upon the price relationship to the levels identified. If the price reaches any of its levels, it activates a setup. It provides a specific structure.
If we take a look at the gold market as an economic indicator, we're beginning to see that the coronavirus was basically a catalyst for revealing a very weak system that was highly leveraged with a lot of risks. With the potential for interest rates coming down to negative rates, which would be very detrimental economically, it's difficult to see how the economy can grow productively when you have to pay your bank money to keep your money. At zero interest rates, you have a carte blanche situation in terms of using those funds without having to pay any interest, so if you're a big corporation or central bank, you can borrow as much as you want and buy your own stock, which is what has fueled the rally of the equity markets over the past few years to the levels that we have now of 3,250 in the E-mini S&P.
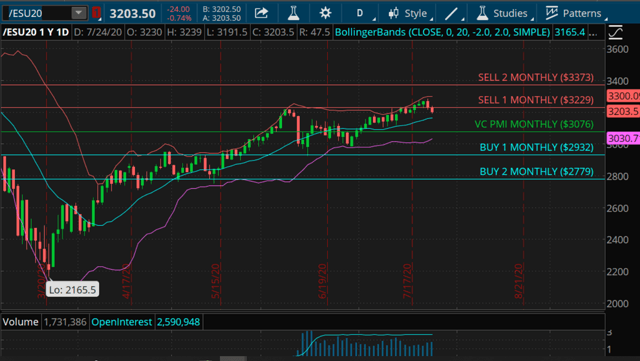
It’s difficult for most people to understand how it's possible that the stock market is making record highs in the midst of the pandemic. The equity markets made a low on March 23 at $2,166, which was the beginning of the coronavirus. It is the worst pandemic in the past 100 years and the common man would have thought it’s going to kill the market and lead to a Great Depression. After the Spanish Flu in 1918, the world went into a massive crash in 1929. Are we setting up for that potential crash or are we moving into a whole new different world and economy based on new technology? Ever since March 23, 2020, we made the transition into a virtual economy and a virtual market. The new virtual market made and is making highs; trading last at 3,230.
We are entering into potentially another tariff war with China; we don't know how China is going to react. The US and China are closing each other's consulates. The future for trade and the economy looks even worse, yet the market continues to climb.
The VC PMI has again accomplished major long-term targets in the metals. All the systems have gone neutral in the precious metals. The gold market has completed short-term, intermediate and long-term goals, as well as the Sell 1 level of the nine-year cycle, which means gold is entering into the levels of distribution of supply.
VC PMI Today at 6:12 AM
SPECIAL UPDATE
ALL TARGETS SHORT, INTERMEDIATE AND LONG TERM HAVE BEEN ACCOMPLISHED AND SYSTEMS ARE NEUTRAL
- If we take a look at the nine-year cycle, you're looking at $1,833 to $2,007 targets.
- It is going to go to $2,007 because gold is trading above the Sell one level of the nine-year cycle.
- The signals have completed short-term targets for gold.
- The only open target right now on the daily is $1,916, which is for day trading purposes.
- $1,900 to $1,916 is the area of resistance on the daily.
- The weekly is way overdone; the market is above it, so it's in a neutral zone.
- The annual has completed the yearly targets of $1,655 and $1,803.
- The monthly completed targets are $1,844 and $1,890.
Gold is trading at the extreme above the mean on the daily, monthly, annual, and 9-year cycle. When you're getting this kind of an alignment, it alerts you as a trader. Gold has moved tremendously up in a short time and therefore you have to take a look at what it is that it has discounted. Remember the last time we saw gold at $1,900 in 2011, it took seven years for the market to reach that same price. When I take a look at where the price is, my experience is that you should choose your instruments to keep your long-term bias intact regardless of the short-term counter-trend signals that occur.
If we go back to September of last year, gold was at around $1,500. You're looking at a $300-$400 move since September 28 of last year. Has the market recalibrated to what the risk is right now in the economy, what's happening here with regards to the pandemic, and how is it going to affect the current economy and the future economy? We don't know what it's going to be like when people go back to a normal economy or some new normal. The volatility has changed and broken any benchmarks.
Trading in the futures markets for me is for day trading unless you're a commercial, a farmer or an institution that needs to take the other side of your product. You can use the futures to protect your stocks by trading the indices. Within the futures contracts, the instrument itself can be applied to just about every asset out there as a derivative. It's probably the most liquid derivative that you can use not only to hedge in the gold market but also crude oil, stocks or other financial instruments.
There are two sides to the market: the cash side (the physical) and the futures contract, which is based on what they call the spot price, which anticipates the future price of that product taking into consideration the fundamentals and the cost of money, interest rates and what time frame you're expecting that delivery.
In the Comex Exchange, a record number of people are using the futures contracts to take delivery of the actual physical gold. The futures contract is 100 ounces of gold. If you buy your a futures contracts right now, 100 ounces of gold at $1,900 would be about $190,000. That would be the face value of your contract, but you can buy the contract on margin and then on notice day, you exercise the right to take delivery. The number of buyers in the gold market who are buying gold in the physical market through the futures contract are at a record level.
Summary
- We are seeing record levels of gold demand.
- The algorithm is currently telling us if you're a buyer be cautious.
- Make sure that you have a strategy that you can protect yourself synthetically in case of a downside draft, which is possible at any time based on the indicators.
- The VC PMI systems are neutral right now, having accomplished major targets.
- The only open signal that we have is for the nine-year cycle.
- We are anticipating the upper end of the extreme of the nine-year cycle to be at $2,007.
- The average price for the 9-year cycle is $1,497.
- All the other signal systems are neutral.
- The market is trading into the area of distribution of supply daily, weekly, monthly, annually, and 9-year cyclically.
- Don't get caught up with the emotion in the market.
- Use prudent risk and money management.
Buyers beware: The tool that we are using to be able to identify the highest probability trades in the gold, silver and the e-mini is the VC PMI. If you have taken a position in the metals markets, congratulations. This is an incredible rally that we've seen only going back to September 28. These kinds of moves are historic and the profits should be historic within the prudent criteria of risk and money management based on your individual profile.


Comments
Log in or sign up to join the conversation.