
Gold price forecast is neutral as the rally in gold continued for a second day on Wednesday, yet the metal stayed below its highs overnight. As of this writing, it is trading just above $1,760.
The moderate weakness of the US dollar was seen as a key factor for supporting dollar-denominated commodities. The market’s prevailing reluctance amid fears of stagflation reversing has also propelled gold’s position as a safe haven. Inflation fears remain high due to recent widespread increases in commodity prices.
Additionally, despite expectations the Fed will cut bond purchases in November, the dollar has fallen slightly without an apparent fundamental driver. To combat excessive inflation, markets have also looked into a rate hike by the Fed in 2022.
As evidenced by the rising yield on US Treasuries, this could prevent the US dollar from depreciating significantly and discourage traders from aggressively pushing gold prices upward. In addition, as US consumer inflation data are released, investors will be able to gauge the Federal Reserve’s course towards normalizing monetary policy.
Minutes from the FOMC monetary policy meeting are still pending release during the US session. Additional gains in the US currency and a new direction for gold could come from a stronger consumer price index and/or an aggressive Fed policy.
We are currently studying the general market sentiment regarding risk, along with the current yield of US bonds, to see if we can find some short-term opportunities in the commodities market.
Gold Price Technical Forecast: Locked Between 20 And 50 SMAs
(Click on image to enlarge)
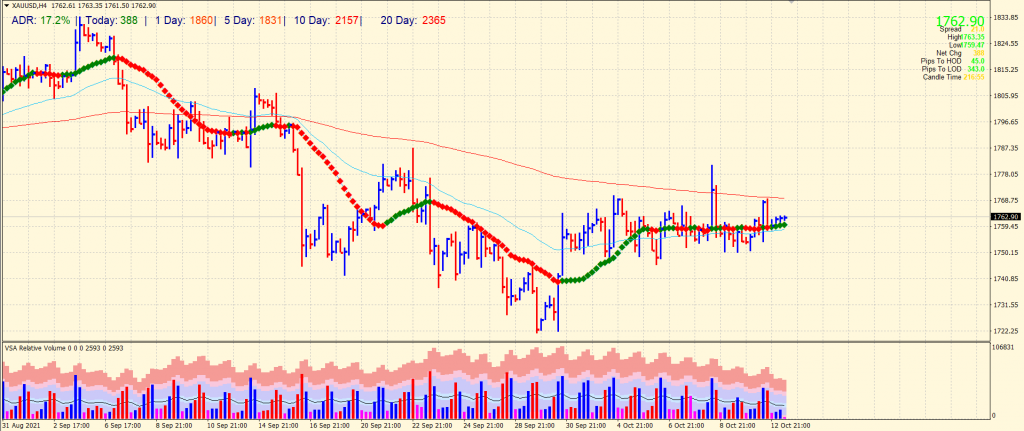
The gold price remains in a tight consolidation. The price is wobbling between 50-period and 200-period SMAs on the 4-hour chart. It looks like traders are waiting for some triggering event as the average daily range is still 16%. Although the price is above the 20-period SMA, the price bars are too small, and the volume is too low, below the average line. However, the down bar rejected from 200-period SMA closed near the lows with a high volume. It indicates that sellers are holding dominance at the moment. The upside attempt may find resistance at 200-period SMA around $1,768 ahead of Oct 08 swing highs at $1,780. On the flip side, $1,750 is the interim support ahead of $1,722.

Comments
Log in or sign up to join the conversation.