
Gold has been choppy and side-way consolidating since mid-April and between 1,660 USD and its current yearly highs around 1,770 USD.
While more active traders might argue that the current price action is quite boring and one could get 'more action' in other precious metals like Silver, we have more and more the feeling that the current choppy performance is nothing more than a 'taking-a-deep-breath' before we finally get to see a bullish breakout with activated targets around the current all-time highs around 1,920 USD and even higher significantly above 2,000 USD.
Is the US and Fed yield cap a bullish catalyst for Gold?
We come to this conclusion when looking at the bigger picture: while the latest economic projections from the US labour market last week surprised and came in better than expected, they are nothing more than a weak glimmer of hope with an unemployment rate at 13.3% after the Coronavirus lockdown.
In addition, renewed tensions between the U.S. and China in regards to their trade deal with rising concerns of a break-up of the Phase-1 trade deal from last December, but also the danger of an escalation with regard to the conflicts in Hong Kong and US intervention, geopolitical tensions hover above the market like a sword of Damocles.
Furthermore, the civil war-like conditions in the US certainly do not contribute to increased risk appetite among market participants.
And then there is the massive monetary stimulus from the Fed: the US central bank has pushed its balance sheet now above the 7 trillion USD mark with further stimulus and expansion to be expected.
Here, not only the remarks from Fed chairman Powell are noteworthy, with him saying in a CBS 60 Minutes interview, that in the long run and even in the medium run, you wouldn't want to bet against the American economy, despite an unemployment rate which could rise as high as 25%, indicating that the Fed will do everything necessary and flood markets with trillions of US dollar to avoid a collapse of the US economy.
But in addition to that, we also need to keep the last Fed statement in mind where the US central bank clearly pointed out that rate caps are already in place since April 1.
Considering this, a sustainable drop in 10-year US Treasury yields below 0.60% seems only a question of time, leaving Gold with a rather sooner than later and elevated probability of a bullish breakout.
How to trade Gold in this environment?
Bearing all this in mind let us come to the conclusion that long setups in Gold are to be favoured, technically as long as we trade above the 1,660 mark.
Should Gold break above 1,745 USD, a bullish signal would be generated and a timely attack and break above the current annual highs at around 1,765 USD should follow, activating an initial stop-over around 1,800 USD.
Should such a run coincide with the above-mentioned break below the 0.60% mark in 10-year US yields, Gold should go for a stint which aims for the all-time highs around 1,920 USD.
In fact, such a run would also be necessary from a risk-reward perspective, since a long entry with a break above 1,745 USD and an initial stop at 1,660 USD needs a minimum run as high as 1,920 USD to generate a risk-reward ratio in the region of 1 to 2:
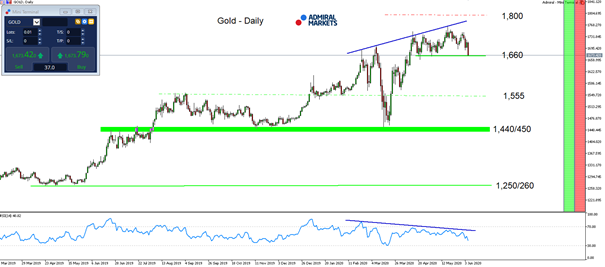
Source: Admiral Markets MT5 with MT5-SE Add-on Gold Daily chart (between March 7, 2019, to June 5, 2020). Accessed: June 5, 2020, at 10:00pm GMT - Please note: Past performance is not a reliable indicator of future results, or future performance.
In 2015, the value of Gold fell by 10.4%, in 2016, it increased by 8.1%, in 2017, it increased by 13.1%, in 2018, it fell by 1.6%, in 2019, it increased by 18.9%, meaning that after five years, it was up by 28%.


Comments
Log in or sign up to join the conversation.