


Gold price (XAU/USD) attracts some sellers to around $4,265 during the early Asian session on Thursday. The precious metal extends its downside after the US Federal Reserve (Fed) raises interest rates and signals another rate increase is likely this year.
The Federal Open Market Committee (FOMC) voted unanimously to lift the benchmark federal funds rate to a range of 3.75% to 4.0% on Wednesday. It was the US central bank’s first rate hike since July 2023.
During the press conference, Fed Chair Kevin Warsh restated his concerns over inflation, saying too many categories of products and services were showing annualized price gains above 3% on a 6- and 12-month basis. Warsh flagged further increases in borrowing costs in the coming months, sending the US Dollar (USD) higher and weighing on non-yielding bullion.
“That’s hawkish. If the chair thinks policy is accommodative, then you’ve got more work to do,” said Michael Gapen, chief US economist for Morgan Stanley.
Higher interest rates typically weigh on gold because the precious metal does not pay interest, making yield-bearing assets relatively more attractive.
US President Donald Trump on Wednesday demanded the US central bank slash interest rates to 1% “or less,” hours after the Fed announced its first rate hike since 2023. Ongoing friction between the White House and independent Fed concerns could boost safe-haven flows and help limit the yellow metal’s losses.
Gold support capped as yields and Dollar strength counter safe-haven bid
Analysts at Commerzbank observe that the recent pullback in Gold, which slipped to around USD4,292, reflects a tug-of-war between geopolitical safe-haven demand and macro headwinds. They note that “higher Treasury yields and the stronger USD continue to offset some of the safe-haven support from geopolitical risks,” limiting the metal’s ability to capitalise on risk-off sentiment. The bank also links the robust precious-metal price dynamics to India’s inflation backdrop, highlighting particularly strong Gold and Silver jewellery inflation, while underlying core inflation excluding precious metals remains much softer.
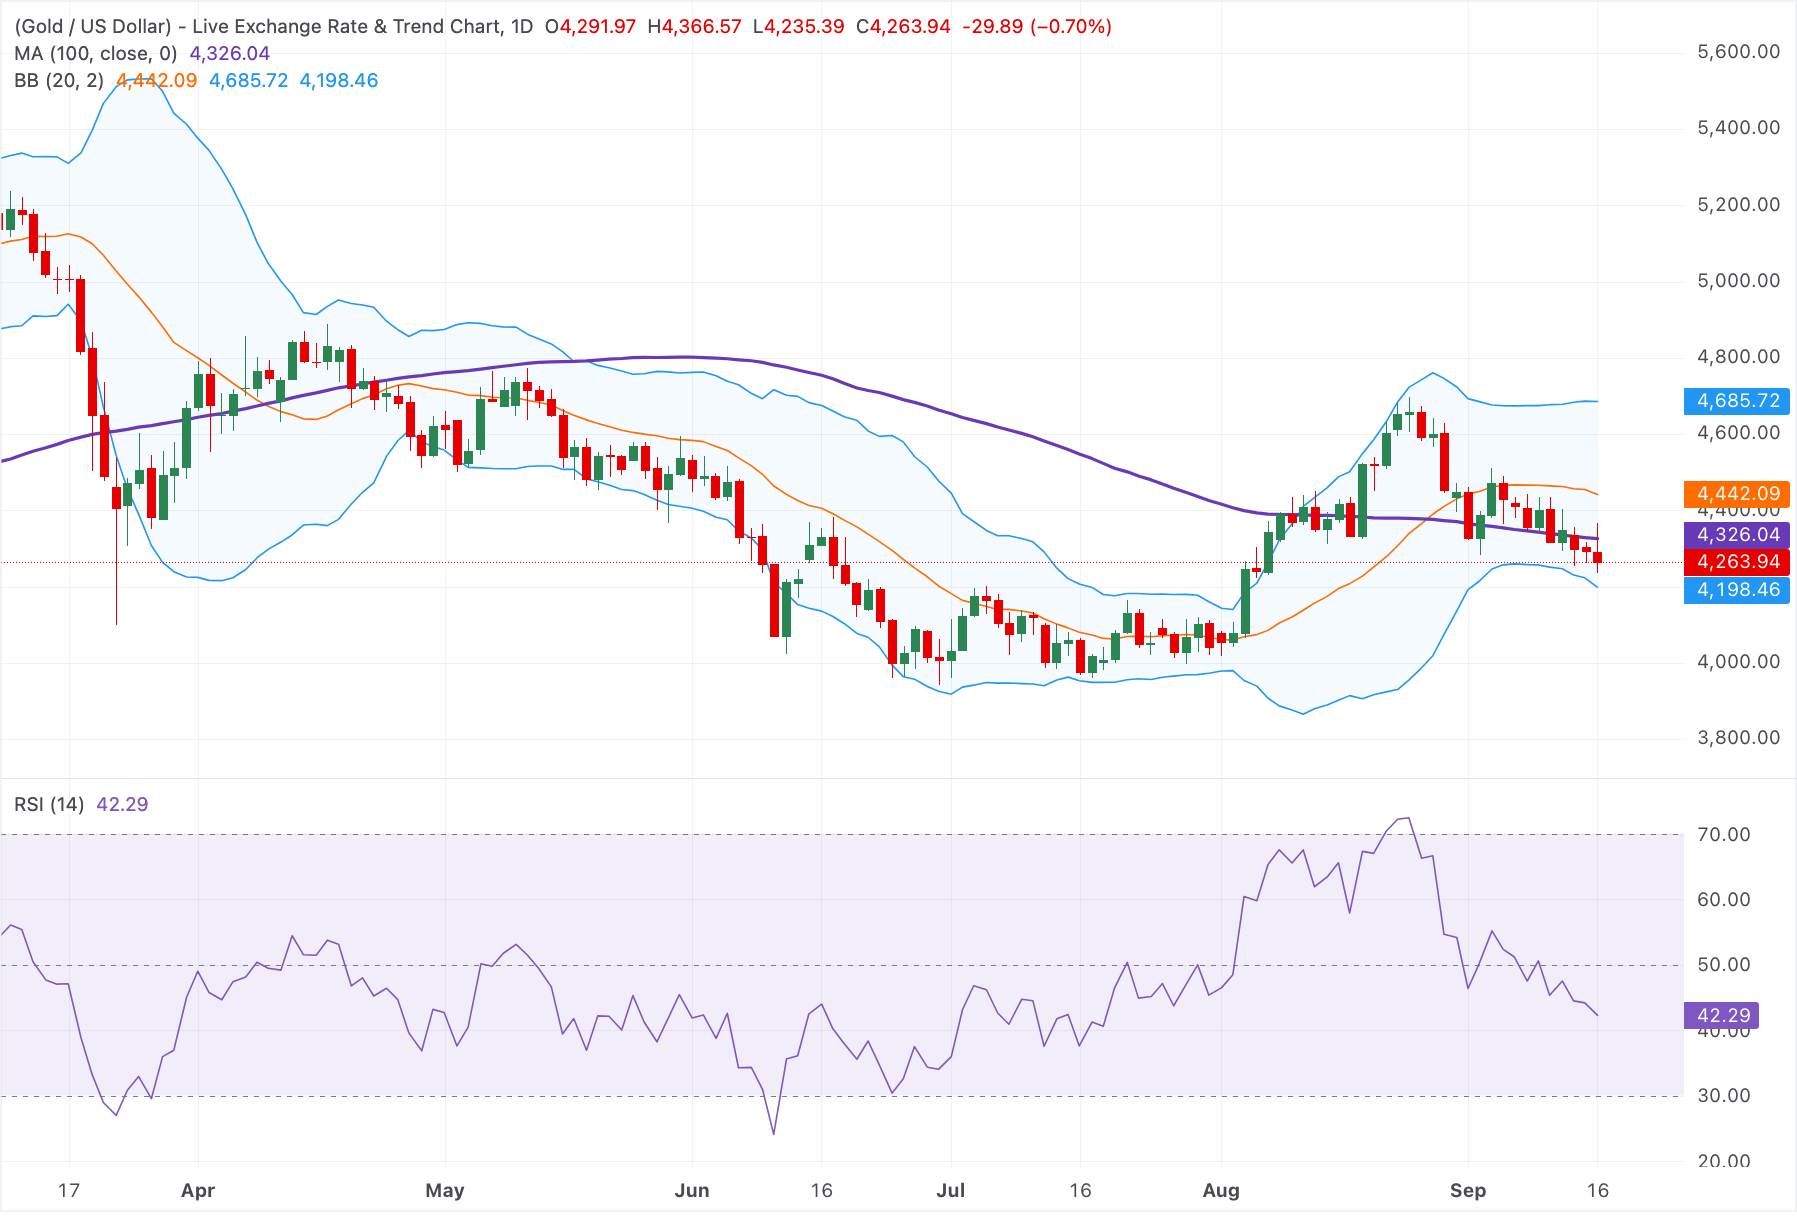
Technical Analysis: Gold remains capped below the 100-day SMA
In the daily chart, XAU/USD stays capped below the 100-day Moving Average (MA) and the Bollinger Bands’ 20-period simple moving average (SMA), keeping the near-term bias tilted to the downside despite only moderate momentum, with the Relative Strength Index (14) hovering around 42 and pointing to lingering bearish pressure rather than capitulation.
On the topside, initial resistance is located at the 100-day MA around $4,325, with the Bollinger mid-line reinforcing a higher barrier near $4,440 and the upper band further up around $4,685, levels that would need to be reclaimed to ease the current bearish tone. On the downside, the lower Bollinger band offers the next notable cushion around $4,200, where buyers may attempt to slow the decline if selling pressure extends.

Comments
Log in or sign up to join the conversation.