


Gold price (XAU/USD) tumbles to near $3,985 during the early Asian session on Thursday. The precious metal extends its downside as persistent inflation forces the US Federal Reserve (Fed) to maintain its tightening policy.
The US Consumer Price Index (CPI) rose 0.4% MoM in October after advancing 0.6% in September, the Labor Department's Bureau of Labor Statistics reported on Tuesday. This figure came in hotter than the 0.3% expected and strengthened expectations that the Fed will raise interest rates next month.
“CPI came out a little hotter than expected, and the market is interpreting that it warrants higher rates at the December meeting,” said StoneX Senior Market Strategist Bob Haberkorn.
Bets on a 50-basis-point Fed rate hike in December began to build after Fed governor Christopher Waller said he would support more aggressive action if CPI came in too hot. Higher interest rates typically undermine the precious metal by making interest-bearing assets more attractive.
The probability of a 25 bps rate hike is fully priced in, while the possibility of a 50 bps hike rose to 12.7% from 0% before the data, according to the CME FedWatch Tool.
Traders will take more cues from the release of the US October Producer Price Index (PPI) inflation data on Friday for fresh impetus. If the report shows hotter-than-expected outcomes, this could exert some selling pressure on the yellow metal in the near term.
Gold shines as risk-off tone weighs on equities and supports bonds
Analysts at Deutsche Bank note that while "credit was actually fairly flat on both sides of the Atlantic," the broader "risk-off tone in equities meant it was a good week for gold, which was up +5.06% (-0.42% Friday) in its best week since August." They add that, "along with the risk-off tone from the AI selloff, that helped to bring down sovereign bond yields around the world." Even so, Deutsche Bank points out that "the 10-year US Treasury yield is up +1bps at 4.87% and Brent down around a percent as I type," underscoring the mixed cross-asset backdrop into the latest session.
Goolsbee flags ‘real inflation issue,’ pushing Fed tone deeper into hawkish territory
Fed’s Goolsbee delivered a distinctly more hawkish message, with an 8/10 FXS Speechtracker score standing notably above the 6.8/10 historical average and underscoring rising concern about persistent price pressures. The emphasis that the latest CPI was “borderline disturbing,” that services inflation is “not coming down,” and that “we have a real inflation issue on our hands” signals growing discomfort with underlying inflation dynamics even as the job market is described as steady and stable. Repeated references to dealing with persistent inflation and the risk of expectations becoming unanchored reinforce a bias toward keeping policy tight and leaving the door open to further action, a backdrop that tends to support the Dollar against lower-yielding peers.
The FXS Fed Sentiment Index rose by 1.69 points to 145.61, keeping the policy tone firmly in hawkish territory well above the neutral 100 mark. The combination of an elevated FXS Fed Sentiment Index and an above-baseline FXS Speechtracker score suggests markets should continue to price a higher-for-longer Fed path, a configuration that is typically constructive for the Dollar and a headwind for risk-sensitive currencies.
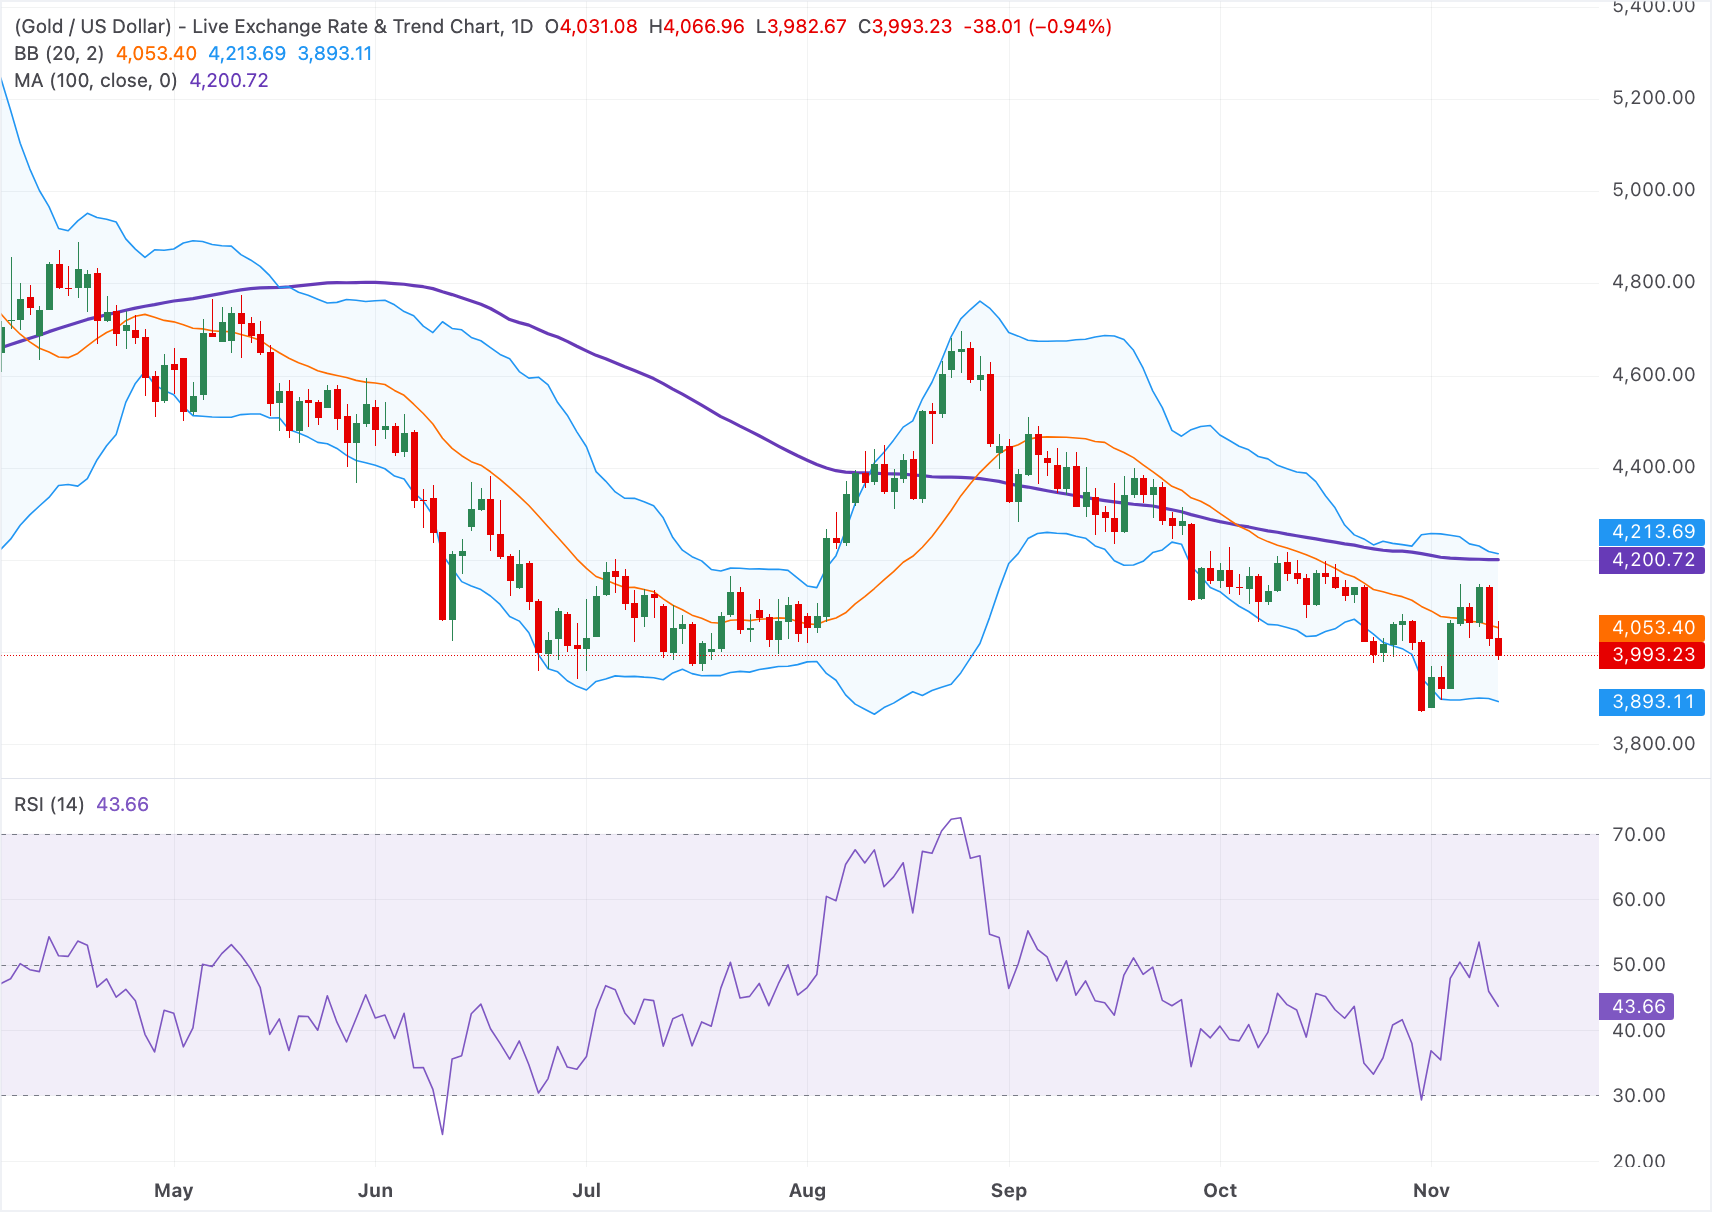
Technical Analysis: Gold retains a negative outlook below the 100-day SMA
In the daily chart, XAU/USD remains under clear downside pressure, holding below the 20-day Bollinger simple moving average and the 100-day simple moving average, which together reinforce a bearish near-term bias. Price is compressing in the lower half of the Bollinger envelope, while the 14-day Relative Strength Index at 43 stays below the midline, hinting at subdued but not oversold bearish momentum.
On the topside, initial resistance is located at the Bollinger middle band around $4,055, followed by the 100-day SMA at $4,200 and the upper Bollinger band near $4,215. On the downside, the next notable support emerges at the lower Bollinger band, now seen close to $3,895, where sellers may be tempted to take some profit if the decline extends.



Comments
Log in or sign up to join the conversation.