


Gold (XAU/USD) loses ground on Thursday, snapping a four-day winning streak as the US Dollar (USD) rebounds, while the widening war in the Middle East drives Oil prices higher. At the time of writing, XAU/USD trades around $4,050 after hitting a two-week high of $4,165 on Wednesday.
The United States (US) carried out strikes against Iran for the 12th consecutive night, while Tehran retaliated by targeting US military bases in Jordan and Bahrain.
Oil supply disruptions around the Strait of Hormuz have now spread to the Bab el-Mandeb Strait after Yemen’s Ansar Allah attacked two Saudi Oil tankers in the Red Sea.
Reacting to the attacks in a post on Truth Social, US President Donald Trump warned that “if they do this again, the US will hold Iran responsible,” describing Ansar Allah as a proxy of Tehran. He added that “major military punishment” would be inflicted on both Iran and the Yemeni rebel group.
The latest flare-up pushed West Texas Intermediate (WTI) crude to its highest level since June 11, trading near $91 per barrel at the time of writing, up around 30% so far this month.
The rise in energy costs is adding to inflation concerns and strengthening expectations that the Federal Reserve (Fed) may need to raise interest rates later this year.
Markets are now pricing in a higher probability of a Fed rate hike at the September meeting, with the odds standing at 78%, up from 52% a week ago, according to the CME FedWatch Tool.
As a result, traders appear reluctant to build aggressive bullish positions in Gold, which continues to face headwinds from hawkish Fed expectations, a broadly stronger US Dollar and elevated US Treasury yields.
The benchmark 10-year US Treasury yield trades around 4.71%, its highest level since January 2025. Higher yields tend to weigh on Gold by increasing the appeal of interest-bearing assets.
TD Securities warns that "the higher rate environment suggests that the yellow metal may again be destined to drop back to support at around $3,900/oz, before any new highs occur some twelve months from now."
Technical analysis: $4,200 remains the key hurdle
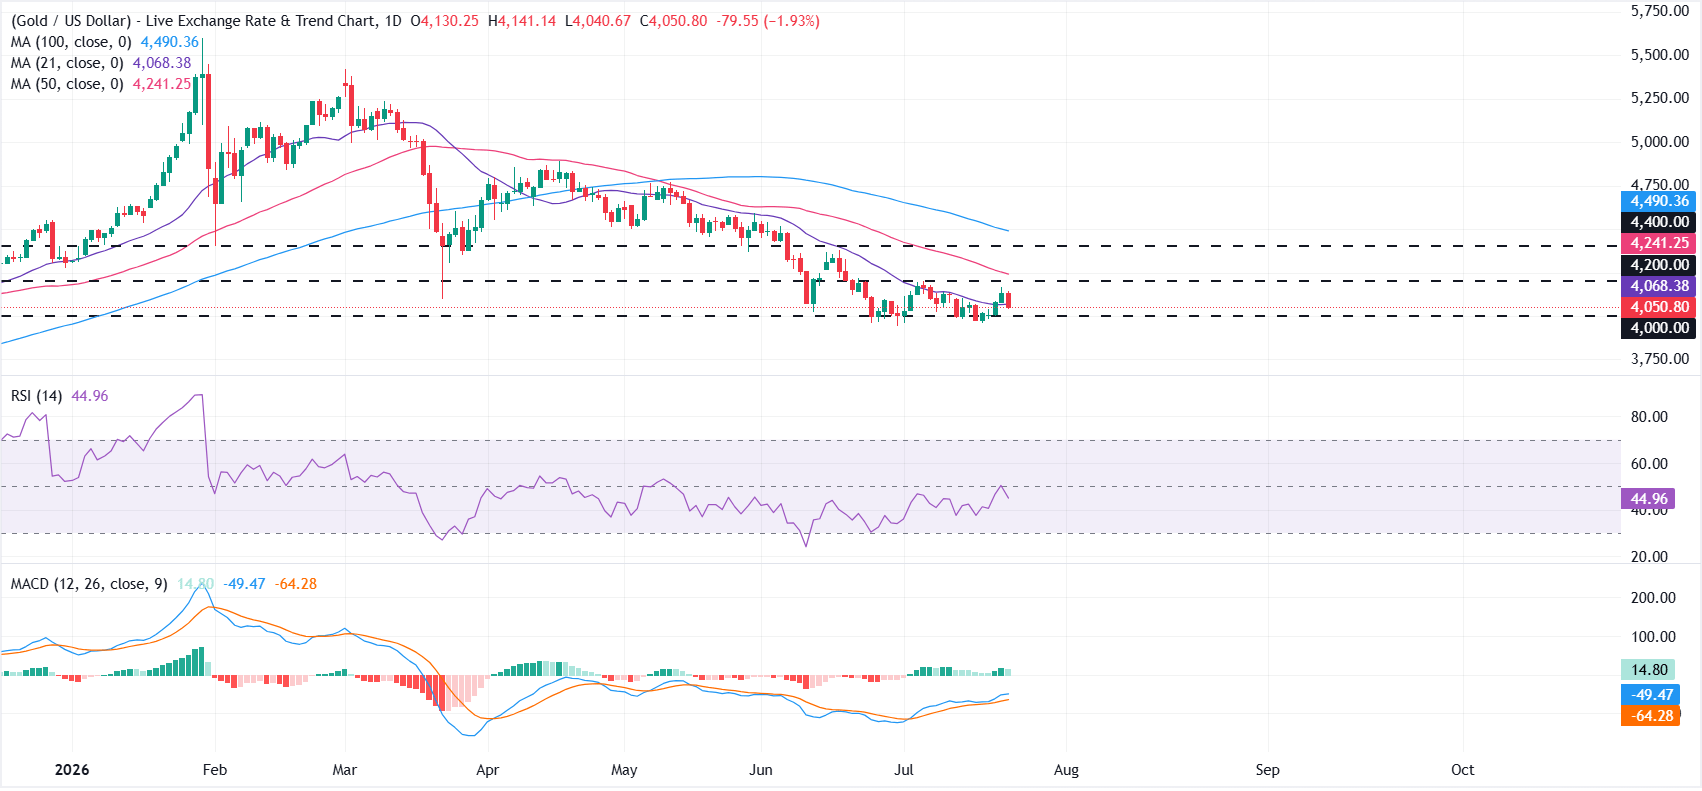
On the daily chart, XAU/USD maintains a bearish near-term bias as it struggles to stay above the 21-day Simple Moving Average (SMA) at $4,068 and trades well below the 50-day SMA at $4,241.
The broader trend remains capped by the 100-day SMA near $4,490, while the Relative Strength Index (RSI) around 45 suggests only modest, range-bound momentum.
The Moving Average Convergence Divergence (MACD) indicator has turned positive but still merely hints at stabilizing downside pressure rather than a decisive bullish reversal while price stays below these key averages.
On the topside, initial resistance is located at the horizontal level of $4,200, followed by the 50-day SMA at $4,241. A daily close above these would open the way toward the next hurdle at $4,400 and the longer-term cap at the 100-day SMA near $4,490.
On the downside, immediate support is seen at the psychological $4,000.00 level, where a break would likely reopen the path toward a deeper corrective phase in the Gold price.



Comments
Log in or sign up to join the conversation.