


Gold (XAU/USD) continues to fall as expectations for further Fed tightening weigh on prices. The break below key weekly support adds to the risk of further declines. The upcoming PCE inflation report could shape interest rate expectations. Stronger inflation may increase pressure on gold, while softer data could support a recovery. Gold also needs to regain its former support area to improve its technical outlook.
Gold under Pressure Ahead of Key PCE Inflation Report
Gold continues to move lower as expectations for further Fed tightening offset the benefit of falling oil prices. WTI crude has lost more than 20% in November, while gold has declined about 8%. Lower energy costs have therefore provided little relief. Tariffs and rising technology costs may keep underlying inflation elevated even as cheaper oil reduces energy expenses. Persistent inflation keeps the focus on interest rates. Higher rates increase the opportunity cost of owning gold because it pays no interest. A stronger dollar also raises its cost in other currencies.
October meeting minutes showed that some Fed officials would consider a larger December increase if inflation data deteriorated. Christopher Waller also raised the possibility of a half percentage point increase or faster subsequent tightening. These messages support the dollar and limit gold recoveries.
The BEA will release October PCE inflation data on November 25. A monthly core reading above the expected 0.3% could support expectations for December and January rate increases. A reading of 0.1% or less could reduce those expectations and support gold. Preliminary November business surveys will also influence the dollar. If Fed officials push back against faster rate increases, gold could find additional support.
Gold Breaks below Weekly Descending Triangle Support
The gold chart below shows a descending triangle with a falling upper boundary and a horizontal base around $3,850 to $4,000. Gold failed to remain above this support area and continued to move lower. The red circle marks the final recovery attempt near the triangle floor. The large weekly decline extends below the former support range. This breakdown shifts attention toward lower historical support levels.
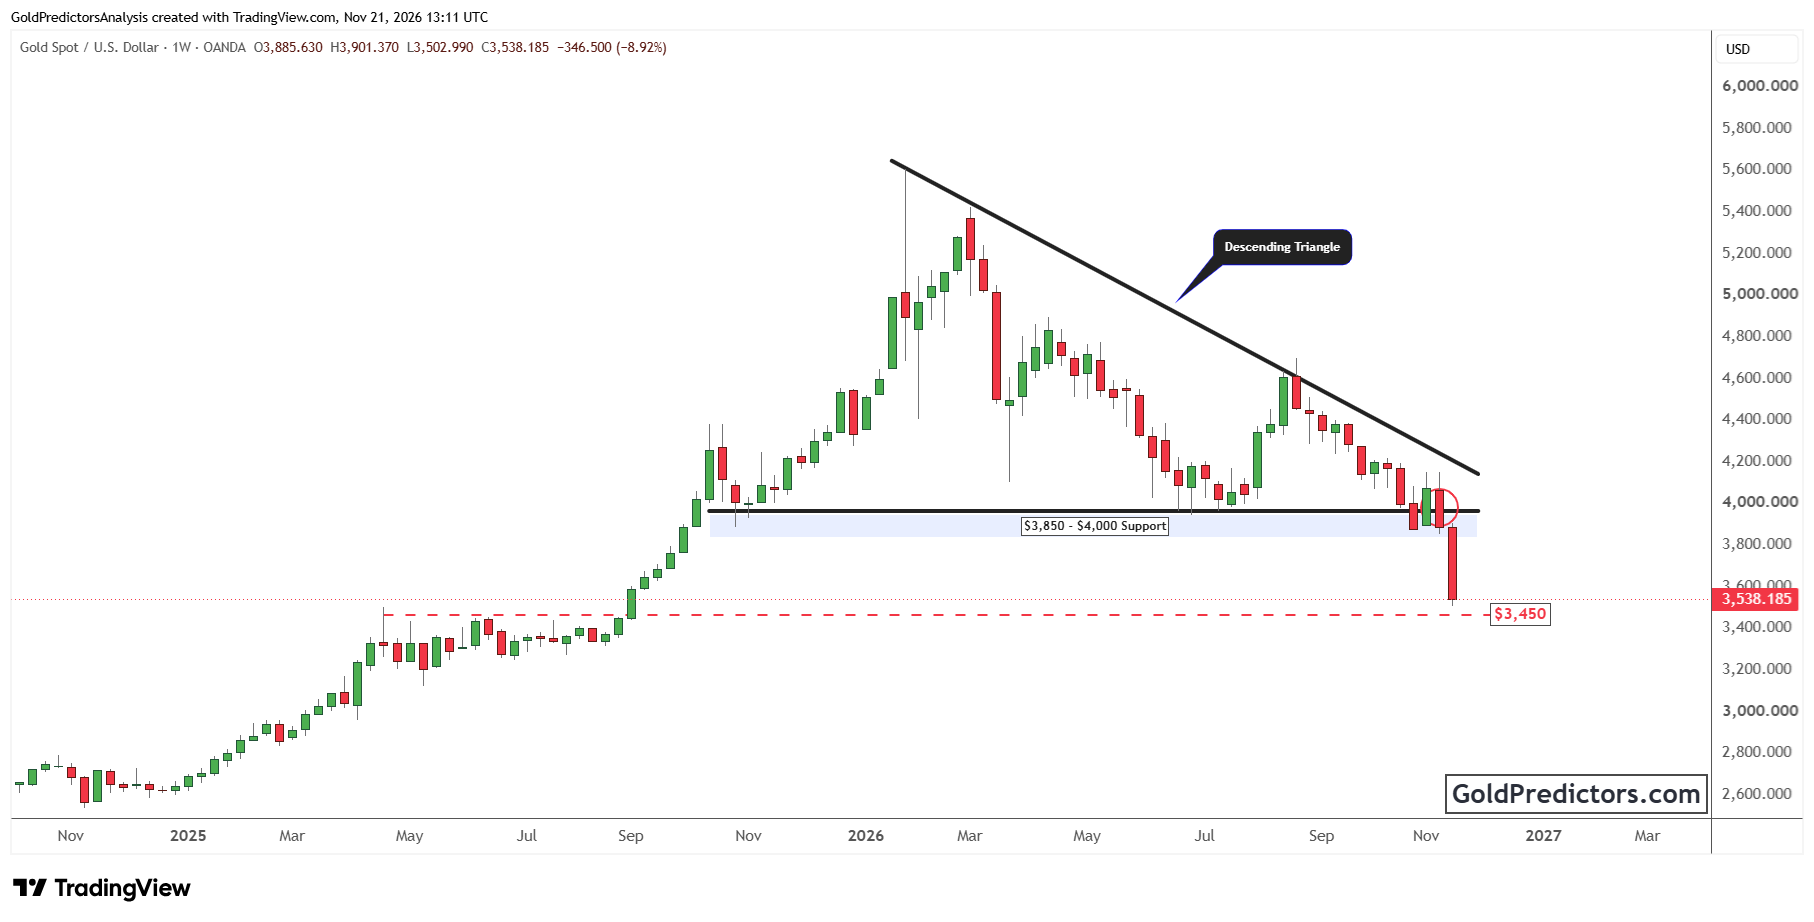
The $3,500 area provides the first nearby reference. Below it, the dashed horizontal support lies near $3,450. This line marks a previous price ceiling before the earlier advance accelerated. A test could slow the decline, but gold needs to establish a base to signal stability. A sustained move below $3,450 would expose the former consolidation area around $3,200 to $3,400. A stable base around these levels could support a recovery, while further declines would keep the outlook negative.
Any recovery initially faces resistance around $3,850 to $4,000. Gold must regain this former support area and remain above it to weaken the breakdown signal. The falling trendline marks the next resistance area as it slopes toward $4,200. A sustained move above that boundary would provide stronger evidence of a trend change. Until then, recoveries may remain vulnerable to renewed declines.
Gold Outlook: Downside Risks Persist Ahead of PCE Inflation
Gold retains a negative outlook as Fed tightening expectations and the weekly triangle breakdown point in the same direction. The immediate downside references are $3,500 and approximately $3,450. Stronger inflation could increase pressure on these levels. Softer data may support a recovery, but lasting technical improvement requires gold to reclaim $3,850 to $4,000. The response to PCE inflation will help determine whether the decline extends or begins to stabilize.



Comments
Log in or sign up to join the conversation.