


Gold price (XAU/USD) declines to near $4,285 during the early Asian session on Wednesday. The precious metal remains under selling pressure amid elevated US Treasury yields as surging crude oil prices fueled inflation worries and bolstered expectations that the US Federal Reserve (Fed) would raise interest rates later on Wednesday.
The benchmark 10-year US Treasury yield note rose to its highest since 2007, reaching 5.041%. The yield later came off its high, last up more than 3 basis points (bps) to 5.00%. Higher Treasury yields raise the opportunity cost of holding non-yielding bullion, weighing on gold prices.
Additionally, oil prices moved higher after Saudi Arabia shuttered a key pipeline that bypasses the Strait of Hormuz. “Higher energy prices cause more inflation. More inflation could cause higher interest rates. That’s not good for gold ... gold is in kind of a range-bound area. It could actually sell off more if rates continue to move higher,” said Daniel Pavilonis, senior market strategist at StoneX.
Traders await the Fed interest rate decision on Wednesday. Financial markets expect that the US central bank will raise the benchmark overnight interest rate by 25 bps to the 3.75%-4.00% range and signal further tightening ahead.
Markets are now pricing in nearly 92.4% odds that the Fed will raise interest rates by a quarter of a percentage point at its September policy meeting on Wednesday, according to the CME FedWatch tool. Higher interest rates typically weigh on gold because the precious metal does not pay interest, making yield-bearing assets relatively more attractive.
US yields hover near 5% as Commerzbank warns on tighter conditions
Analysts at Commerzbank highlight that the recent move in longer-dated US rates saw the "US 10Y briefly rose above 5% before closing 2bp higher at 4.99%." The bank cautions that "sustained yields above this level would further tighten financial conditions," underscoring the risk that persistently elevated borrowing costs could exert additional pressure on the broader market environment.
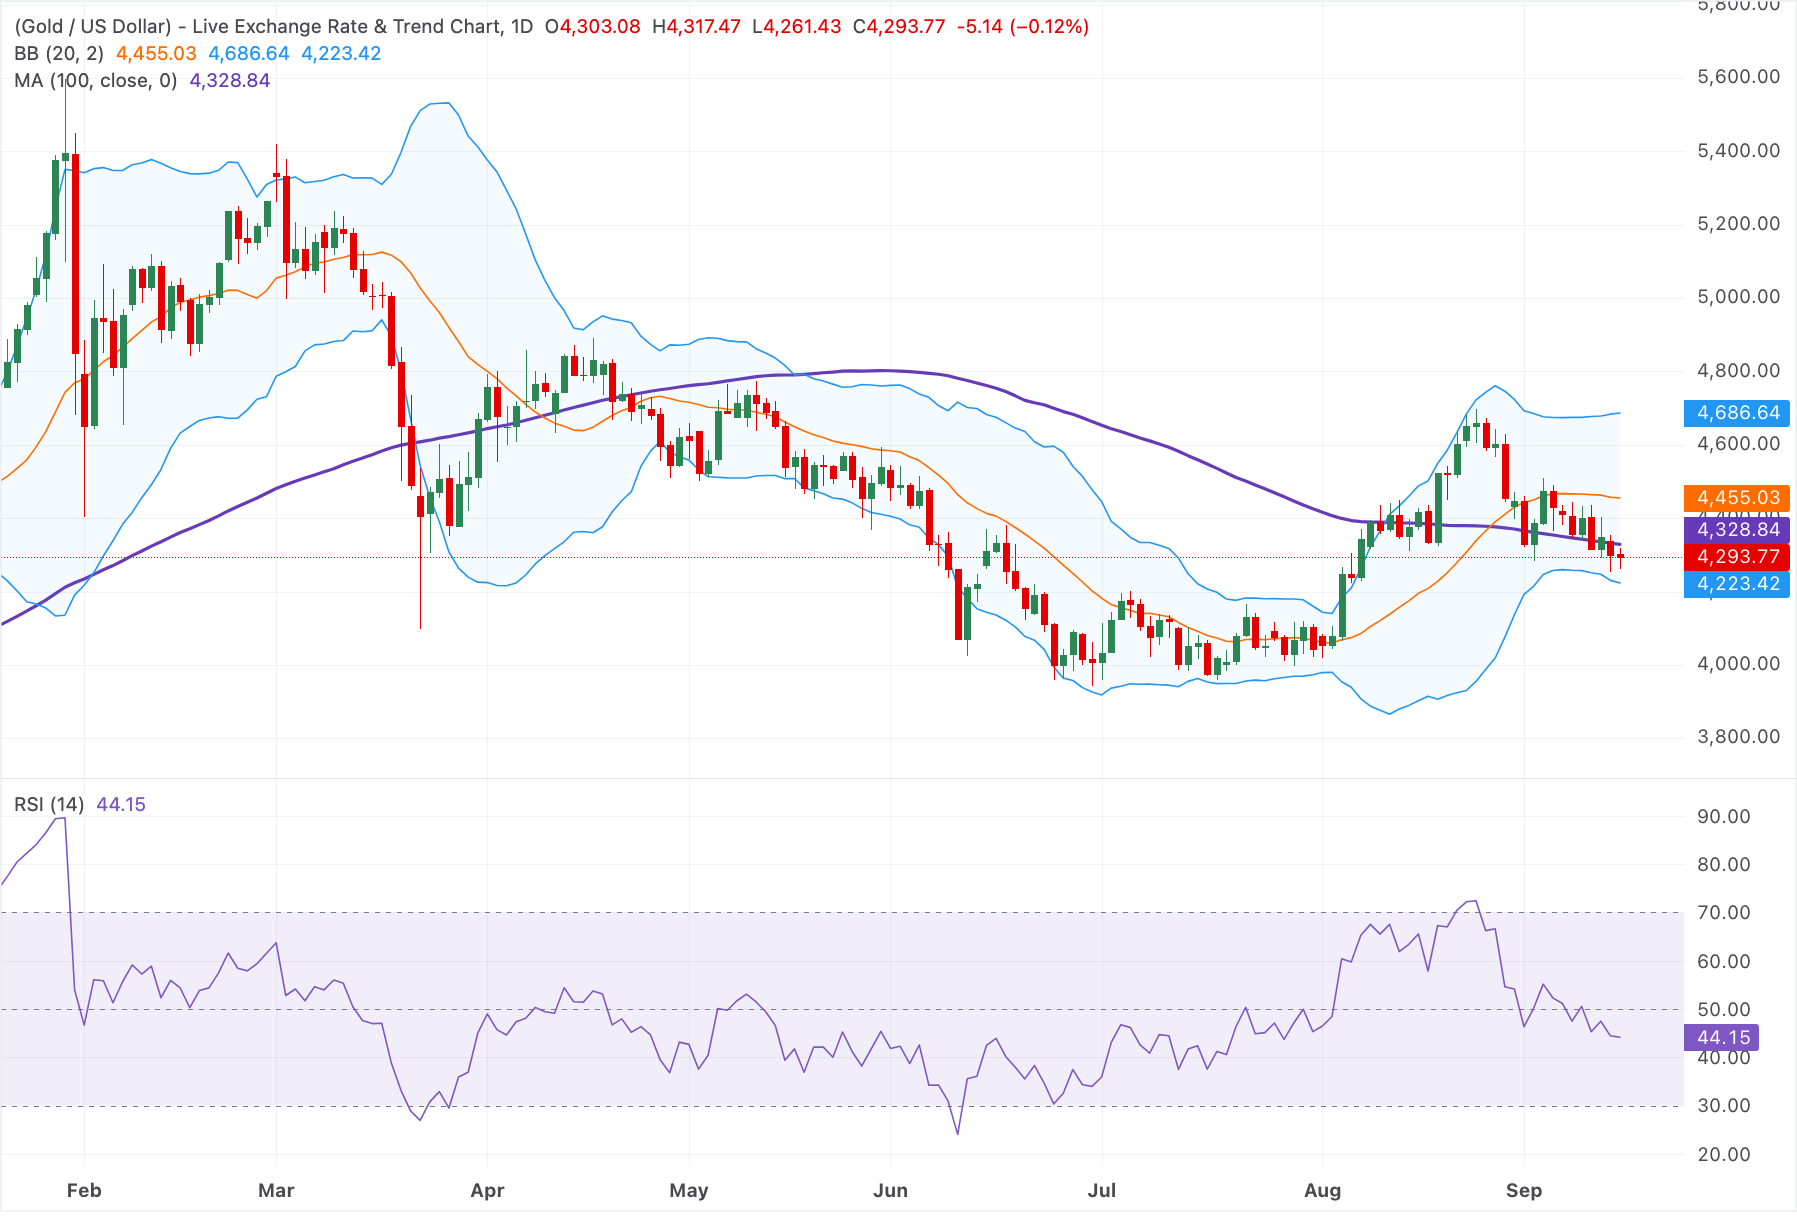
Technical Analysis: Gold remains capped below the 100-day SMA
In the daily chart, XAU/USD holds below the 100-day simple moving average (SMA) and the Bollinger middle band, keeping the near-term tone bearish as price remains capped by these overhead trend and volatility references. The Relative Strength Index (14) at about 44 leans slightly to the downside, suggesting lingering downside pressure rather than an imminent bullish reversal.
On the topside, initial resistance appears at the 100-day SMA around $4,330, with the Bollinger middle band near $4,455 acting as a subsequent barrier, while the upper Bollinger band up by $4,685 defines a more distant cap if a stronger rebound develops. On the downside, the latest Bollinger lower band at approximately $4,225 offers the first notable support, and a clear break beneath this volatility floor would reinforce the prevailing bearish bias and open the door to deeper losses.

Comments
Log in or sign up to join the conversation.