
Gold traded last at $1,469.30. The market is up $4.30. On the chart, you can see that the daily signals from the Variable Changing Price Momentum Indicator (VC PMI) are at $1465, which is the daily average price. On the right, you can see that the weekly average price is $1,465. Whenever we see the relationship between the daily and weekly harmonically aligned like this, it is usually a very high probability signal that we can identify. The market has reverted back from that mean daily average of $1465 and pretty much on the weekly. Both have met targets; daily at $1,469 completed at 5:30 am yesterday and reverted right back down to the mean. Then, it reverted right back to the Sell 1 target for the daily at $1,473. The daily signal has completed the target of $1,469 to $1,473. The weekly signal has established a bullish trend momentum, and it is on the way to the target on the weekly of $1,478.
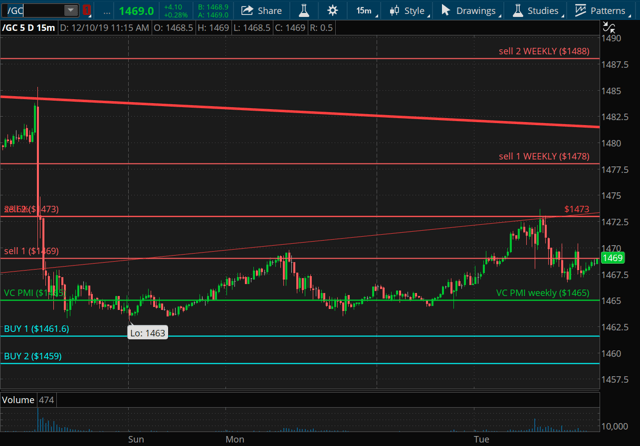
What we do when we look at the daily and weekly numbers, we see if they are synchronized. When they are harmonically synchronized, like they are today, it is a very strong signal with the highest probability of a reversion to the mean. Gold has completed the daily targets of Sell 2 at $1,473 and the Sell 1 at $1,469 from the Buy signal at $1,454. You are looking at a nice trade since the low of $1,463 on December 8 at 3 pm.
Depending on the kind of trader you are and how you manage your risk in your portfolio, it is a personal choice. We are showing you one of the most incredible trading tools that the big institutions use and the top traders use, which they call high frequency or algorithmic trading. We are taking the mystery out of it and showing you on a completely transparent platform, Ticker Tocker, how we use the VC PMI artificial intelligence algorithm to trade the markets. From Buy 1 or Sell 1, there is a 90% probability, and from Buy 2 or Sell 2, there is a 95% probability of a reversion back to the mean from the extremes above and below the mean signified by the buy and sell levels. On this trade, you can see the signal validating the probability factor. For this trade, $1,465 was the daily mean from $1,469, which was the trigger, leading to a $400 profitable trade.
Where you take trades is a question of how you manage risk. As a self-directed trader, you want to make the highest probability trades identified by the system, which is when the price activates the Sell 1 or Sell 2 level, as seen in the chart. Once the confirmation is in, which is what we teach our subscribers, how to identify the trigger point and risk and money management. We execute the algorithm exactly the way the VC PMI shows you to do. If you do so, you can have 90% to 95% probability trades. In this case, after a pattern is completed, you go neutral. You take a break and let the market tell you where it wants to go next. Once you lock in your profit from $1,454 to $1,469, which is a $1,500 profit per futures contract, you then go flat or neutral. You use the VC PMI as a GPS to show you where the market is likely to go.
Using the 15-minute bar on the next close, the market closed below the Sell 1 level of $1,469. It automatically activated the trigger. The close was $1,467.60. When the trigger is identified, the stop is automatically activated at $1,469. With regards to stops, we teach our subscribers not to use straight stops. Use the stop that is appropriate for their size and style of trading, as well as your risk profile. You can use a conservative stop - once the signal is activated, if the market closes above the signal pivot point again, you go neutral. That is your stop. $1,465 is our target. $1,467 is our entry point. Our stop is $1,469 on a close above. The trade was completed at 8:45 am.
One of the rules the VC PMI teaches self-directed traders is identifying the supply and demand of the market on a daily, weekly and monthly basis. We want to identify the highest probability trades. The artificial intelligence tells you not to trade the mean because it is a 50/50 standard deviation, meaning the market can go up or down. Let the market come to you. The VC PMI takes the guessing out of trading. It removes the uncertainty about where the market is going. The market's function is based on supply and demand, which is the basis for the VC PMI. The VC PMI identifies the average price, as well as two levels above and two levels below. By relying on the principle of reversion to the mean and the Fibonacci structure, it makes trading far easier. The VC PMI shows you visually that when the market is trading in the red zone, it is a distribution of supply area and you are likely to find sellers. Once you accomplish a target, you go neutral when you accomplish your target. The trigger is when the price closes below that trigger. The entry point was $1,468.60 with a stop at $1,469 and the target was at $1,465, which was completed at 8:45 am. Then, you wait and let the price come to you.
When the price closes above the mean, we don't trade until there is a confirmation of the trend momentum of the market: bullish or bearish. When the price closes above the mean, it identifies the sentiment of the market as bullish. When the trend momentum turns bullish, it activates the target above, in this case, $1,469. No trades in futures. Another activation on the daily. The weekly signal of the mean at $1,465. We activated a daily signal above the mean generating a daily trend momentum and a weekly trend momentum. The target is $1,469, which was met at 1 am last night, and then back to neutral again.
We look for the highest probability trades. It is one of the most difficult things for some of our subscribers to do, is follow the VC PMI's recommendations and not follow their bad habits. The VC PMI can be used to trade futures, options, stocks, ETFs or whatever. The principles are the same.
On the chart, we went back to neutral. When the VC PMI identifies a Sell 1 level, it does not recommend selling at that level. You should not go long from there, since it is only a 10% probability that it will test $1,473 at Sell 2. There is a 90% probability of a reversion to the mean from the Sell 1 level. The market came down to test that level of support. When resistance is broken, around $1,469, it became the support for the next signal. At about 5:30 am this morning, the market again tested $1,469 and activated a buy signal, completing the target from $1,473. Then, we went back to neutral.
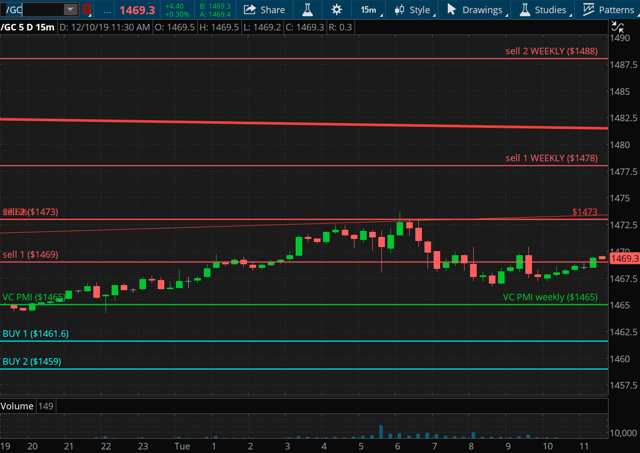
We are now back at the Sell 2 level on the daily and activated a short signal from $1,472.20 with a stop at $1,473, and a target at the level below of $1,469. You can see the reversion. The VC PMI identified the trigger point to go short. This trade gave you an 80 cent risk for a $400 profit, which was completed.
We are now waiting for the market to close below $1,469 to activate a short trigger. If not, the $1,473 tested and closing above on the 15-minute daily chart activates the weekly Sell 1 level of $1,478. The weekly trend momentum is bullish.


Comments
Log in or sign up to join the conversation.