


2019.01.25 Gold Cycle Model Chart
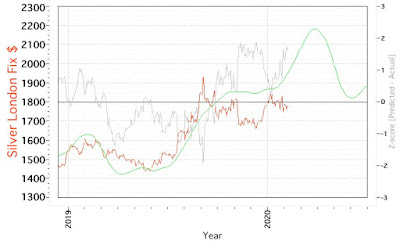
There is a hint here that the months-long right phase shift may be on hold. Much lower prices seem highly unlikely according to the decadal cycles, but we will have to see what happens in the next few months. Perhaps the Au market senses the end of QT. A previous run of the model is shown below and here on the blog. On the medium term model output page, you can see that GLD has been on a buy since 2018.08.21.

2018.12.07 Gold Cycle Model Chart


Comments
Log in or sign up to join the conversation.