

The dire effects of the pandemic continue to spread. Retail stores that have been around for hundreds of years are going bankrupt. The amount of stimulus that is needed is probably far beyond anything being considered today. Gold is at new highs and the corrections are not lasting. We are buying the corrections to increase our long-term holdings in precious metals.
Gold is rising based on the economic problems around the world. Politically, there are hot spots all over the world. US-China relations are strained. Russia is aggressive. The EU is dealing with Brexit and is upset with charges that Putin may be behind the poisoning of a domestic political rival. Authoritarian leaders are arising all over and threatening the liberal, democratic, and capitalistic system that has been in place for much of the world since 1945.
Some new economic numbers came out this morning. The Producer Price Index (PPI) just came out at 0.3% month over month versus the projected level of 0.2%. We use the PPI because it is important to recognize the economic conditions today. In response to the damage caused by the pandemic, the government is in a position to print as much money as needed. The issue has been politicized, but we are running into some real economic problems that represent weakness in the dollar. The damage to the economy is far greater than what the market is factoring in, especially when the government is printing so much more money. The impact will be inflationary on the dollar. When you print money, it devalues each dollar and leads to inflation. The PPI is a good indicator for seeing when that inflation may start.
We trade gold because it trades against the US dollar. When you buy gold, you are selling dollars. Gold is another currency. Government officials are not talking much about inflation. They have basically given themselves a license to print as much money as necessary.
The effects of the pandemic are still to be seen. For example, demand for grain is high. The harvest is largely completed. We have yet to see the total world grain production. Soybeans are trading at almost $10 a bushel, up from about $8.50 in March. It is beginning to tell us that there is price pressure in the grains markets, which is food. The next challenge we are going to have is food shortages. Inflation will show up in food and already is showing up. This will lead to an increase in the price of precious metals.
Gold
Courtesy: Ticker Tocker
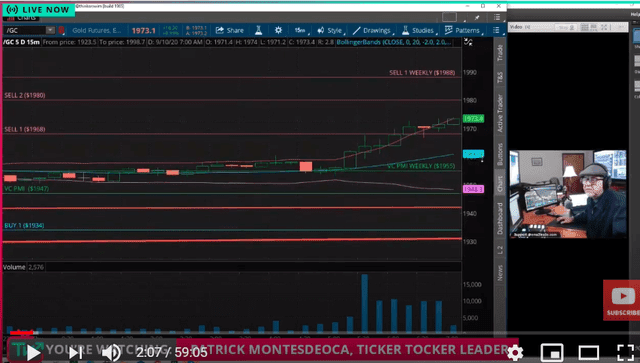
Gold is trading last at $1972.80, up about $17.90. We are approaching the daily Sell 1 level target of $1968. The next target is $1980, which is the Sell 2 daily level. The average daily price is $1947. The market has entered into what the Variable Changing Price Momentum Indicator (VC PMI) calls an area of supply. This is the highest probability area to expect sellers to come into the market. It does not necessarily guarantee that sellers will appear, but mathematically, it is about 90% likely. The Sell 1 level, if activated, has a 90% probability of the market reverting from there to the mean.
The market has been trading around the daily and weekly averages over the past few days. The market closing above the average price activated a trend momentum that has completed the first target of $1968.
If you are going to use a system to trade, you must follow the methodology. Otherwise, you may as well flip a coin. The VC PMI tells you the trend momentum above or below the mean, and the likely direction of the market. If the market is trading around the mean, there is a 50/50 chance of the market going up or down. What we seek using the VC PMI is to trade at the extremes above or below the mean, when the likelihood of a winning trade is 90% or 95%.
For day trading today there are no signals since we are looking for the market to activate a short trigger from these high levels.
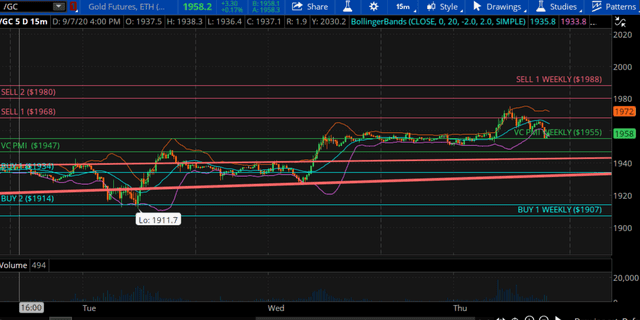
For position or swing trading, the market appears to be coming back from the low of about $1911 on September 8. Then it came into the daily low levels of $1900 and almost activated the weekly level of $1907. This wave told us that the market has the potential to reach the extreme level above the daily levels. The daily and weekly numbers integrate to present a clear picture of where the area of distribution of supply is likely to be. The weekly average of $1955 and the daily average of $1947, present a pretty close relationship for where the market’s average price is located. We use the daily for day trading and the weekly for swing or position trading. The daily and weekly signals are saying that if the market trades through $1955 it would activate a daily and weekly price momentum with the target of $1968. The goal is to buy the extreme below the mean and sell into the daily and weekly targets, depending on your size. If you are doing multiples, you can sell as the market accomplishes the targets. The levels can be used for futures, options, LEAPS, ETFs, stocks or whatever you are trading.
The long-term outlook for gold is extremely bullish. We are also extremely bullish on silver. We are using this indicator to manage the short-term fluctuations in the market. The trend for gold is up. If the market closes below $1968, gold will activate a short trigger. Gold is approaching an area that appears to be extremely overbought.
Monthly Levels
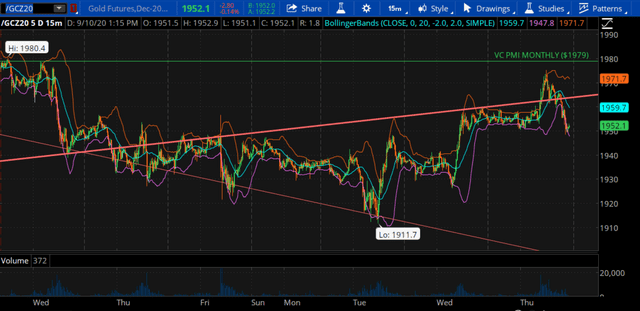
We have been trading from about $1980 on September 1. From $1979 gold activated a bearish price trend momentum. The level below is the target, which for the monthly was $1869. The monthly has activated a bearish trend momentum. The market may run up to $2084 or it might come down to the Buy 1 area of $1869.
The VC PMI takes emotion out of the equation. At these new highs, there are buyers certain the market is going to keep going up and sellers who think it is at a top. The VC PMI has no emotion. It just looks to see what the probabilities are for the market to revert to the mean.
Gold is in a bearish monthly trend momentum. The daily has completed the target of $1968. It has activated a short trigger, while the weekly price trend momentum is still bullish. The daily and monthly signals are harmonically aligned. Closing below $1955 would activate the weekly bearish price momentum. The short trigger that we just got has a weekly target of $1955 and a daily of $1947. This is a time when you might want to use a trailing stop. Start it at your entry point of $1968, in this case, and then you basically have no risk. My goal per contract is $300 for day trading, so once we make that, we get out. Or you can ride it down to the target of $1955 using a trailing stop.


Comments
Log in or sign up to join the conversation.