

We have recommended our subscribers to take profits in gold. The market has accomplished the targets we have been anticipating with a bull market from $1,551 to $1,557. The market rallied into a new high of about $1,557 today so far.
(Click on image to enlarge)
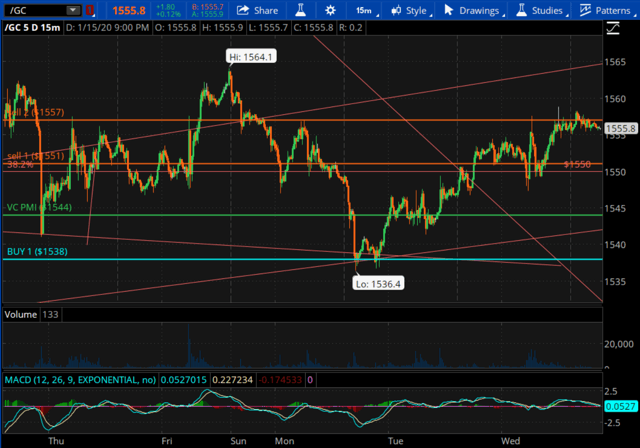
We use the proprietary artificial intelligence of the Variable Changing Price Momentum Indicator (VC PMI) to trade the markets. As we came into this week, the price momentum was bearish because the market closed below the average price of $1,572. In activating that bearish trend momentum, it activated the target below of $1,538.
When the price is trading above the Sell 2 level, it is extremely overbought or in the red area, which is the area of distribution of supply. The algorithm tells you that there is a high probability as the market traded above the Sell 2 level that some sellers would come in. Opening Sunday night, the market activated a bearish signal on a close below $1,572. Our target was $1,538 on the weekly Buy 1 level. The market started coming down, traded above it again, and we suggested to not buy when the market is between the Sell 1 and Sell 2 levels, because the odds favor the market going down back to the mean.
The price reached the Sell 2 level at $1,567 on the 13th at 5:30 am (Pacific Time). The market then came down and met the target below of $1,551. It closed again below $1,551 which activated the daily target of $1,538. On the 13th at 5 pm, it met that target at the Buy 1 level. It then activated a buy signal from the Buy 1 daily level, even though the weekly was still in a bearish trend momentum. The daily, based on shorter-term data, said that the market had begun to find buyers at $1,538. The market crossing the pivot point and then closing above it confirmed that buyers came in at that level. It automatically activates the level above as your target.
The buy signal was at $1,538.70, which we took. Then the market held this level for some time, until the energy around the 13th at 9:30 pm began to move it upward until the mean was completed at $1,544. Then we went flat and waited for the market to then trigger the extreme below the mean of Buy 1 or Buy 2, or for the market to reach the extreme level above the mean of $1,551, which was met, and the $1,557, which was completed this morning. The weekly is still in a bearish trend momentum until the price closes above $1,572 or it comes down to Buy 1 at $1,530 and activates a buy signal. So we have a mixed picture between the daily, which is bullish and which is now flat, and the bearish price momentum in the weekly with the mean of $1,572 and the Buy 1 level of $1,530.
By identifying the level of $1,536 as the level of support, which was the bottom of the correction from $1,613, you are looking at a substantial correction in gold in just a matter of days. What we want to see is if the bullish energy of the market continues to hold these levels and the price action begins to move above the Sell 2 level of the daily at $1,557 again, which will activate the weekly mean of $1,572.
(Click on image to enlarge)
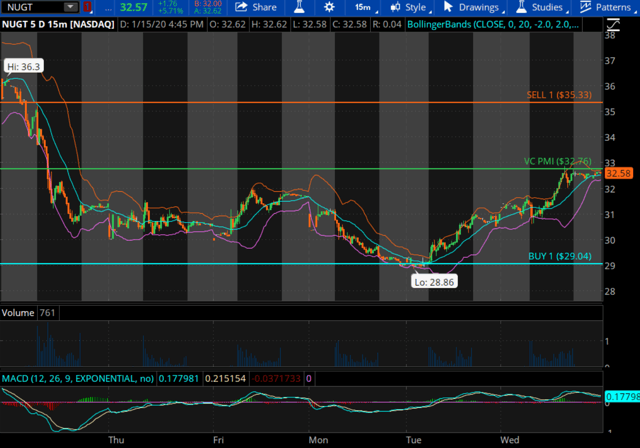
We have taken profits this morning with the targets of $1,557 and $1,551, which were completed. We are holding a long-term position in derivatives and we will add accordingly if we get a chance. We have taken additional profits in some of the assets that we trade, like NUGT, which is a Triple X derivative. We purchased NUGT at about 29, and we are trading near the high at 32.62, so we suggest to lighten up on NUGT. Look to buy corrections in the metals since we believe the market has still to test the upper end of the $1,572 level.


Comments
Log in or sign up to join the conversation.