


Gold (XAU/USD) pares heavy intraday losses to its lowest level since September 2025, trading above $3,550 in the early European session on Friday, albeit retaining its bearish bias for the third straight day. A modest US Dollar (USD) pullback is seen as a key factor supporting the commodity. Meanwhile, traders are overwhelmingly pricing in a Federal Reserve (Fed) interest rate hike at its December policy meeting, which, along with fears of renewed US-Iran tensions, could limit USD losses and cap the non-yielding bullion.
Minutes from the October FOMC meeting, released on Wednesday, signaled a hawkish stance as nearly all officials expected further rate hikes to bring inflation back toward 2%. According to the CME Group's FedWatch Tool, a 25-basis-point (bps) rate increase at the next FOMC meeting in December is virtually a done deal. Moreover, financial markets are bracing for an extended stretch of restrictive US monetary policy well into next year. In fact, traders are pricing in a greater chance of additional hikes in January and April 2027. This has been a key factor behind the relentless selling of non-yielding gold witnessed over the past two weeks or so.
Dollar strength shifts from equity beta to Fed hawkishness
According to TD Securities, “upward US inflation momentum” has driven a regime change in FX, with markets now trading the USD “away from a relative equity regime to a hawkish Fed regime.” The bank notes that “the USD was trading in a relative equity regime for most of 2026 (Fig 2),” but it now trades under a framework “where the USD is supported by the US Treasury curve bear flattening dynamic (Fig 3) and market expectations of the Fed out-hawking other central banks (Fig 4).” In this setting, TD Securities argues that “the USD will likely remain resilient until Fed hawkishness peaks,” adding that “short-term relief for the bullish USD momentum could emerge with the Dec Fed SEP.” They see that peak in hawkishness as a key inflection point, cautioning that “the USD will likely remain resilient until Fed hawkishness peaks, which could play out under two scenarios,” to be further defined as the policy outlook becomes clearer.
On the geopolitical front, The New York Times reported that US President Donald Trump was considering another round of extensive military strikes on Iran. This comes on top of the US-Iran standoff over Tehran's nuclear program and the Strait of Hormuz, helping the safe-haven USD trade within striking distance of its highest level since April 2025. However, extremely oversold conditions on short-term charts hold back traders from placing fresh bearish bets on gold amid a modest USD slide. Nevertheless, the XAU/USD pair seems poised to register losses for the second straight week and seems vulnerable to further losses.
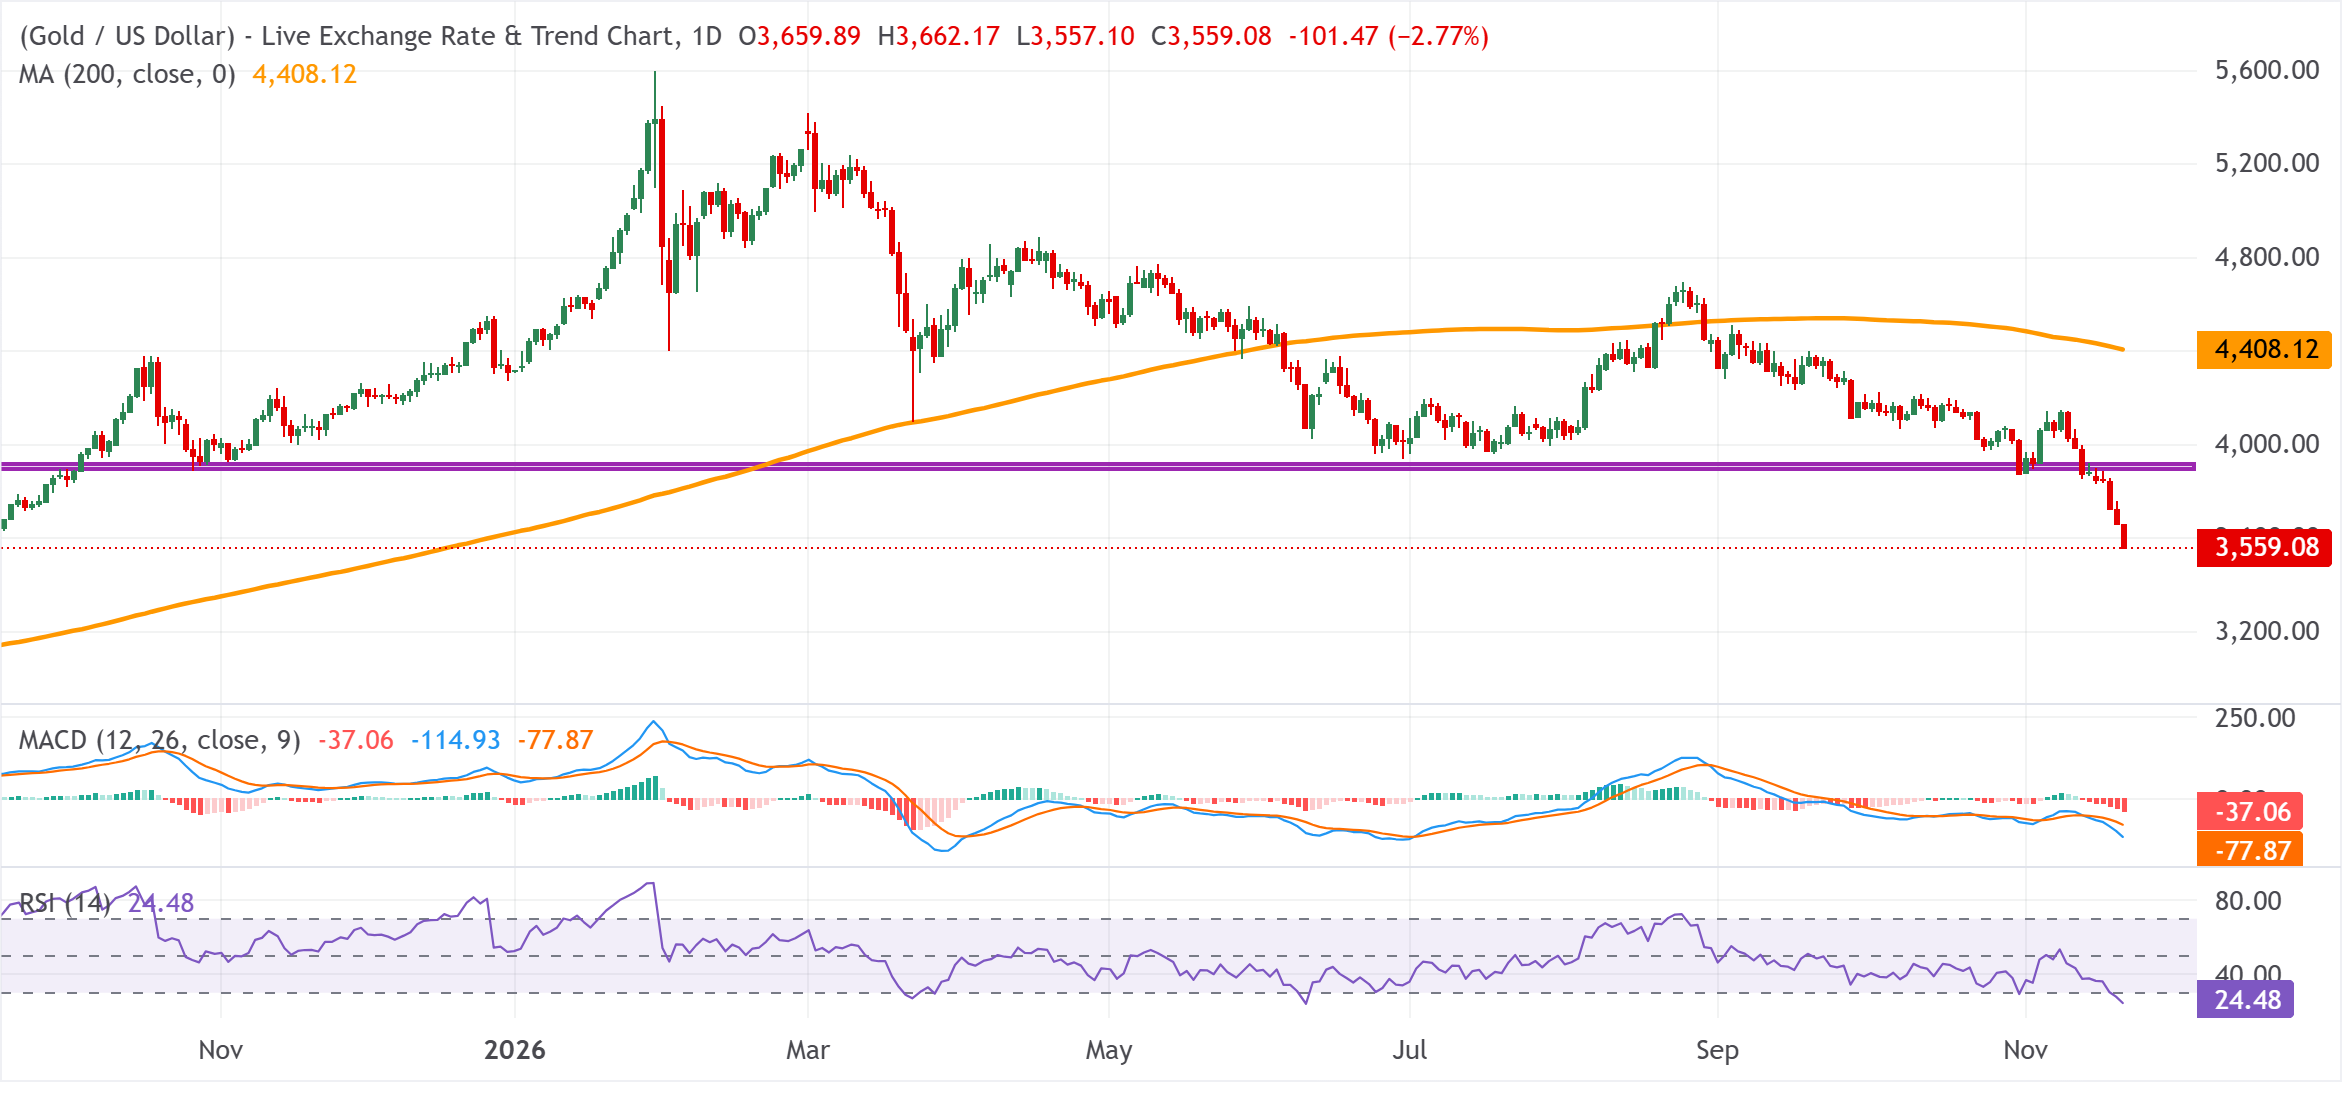
XAU/USD daily chart
Technical Analysis
The XAU/USD pair extends a bearish phase following the recent breakdown below a horizontal support near the $3,900 mark. Moreover, the precious metal holds well below the technically significant 200-day Simple Moving Average (SMA) at $4,408.12, validating the negative outlook. Meanwhile, the Moving Average Convergence Divergence (MACD) indicator remains in negative territory with a widening downside profile. However, the Relative Strength Index (RSI) hovers near 24, signaling oversold conditions, which could slow, but not yet reverse, the prevailing downside pressure.
Hence, it will be prudent to wait for some near-term consolidation or a modest bounce before traders start positioning for an extension of the recent well-established downtrend. That said, any attempted recovery is more likely to be sold into and remain capped near the $3,900 support-turned-resistance. Moreover, a move beyond the 200-day SMA near $4,408.12 marks the level bulls would need to reclaim to ease the broader bearish bias.



Comments
Log in or sign up to join the conversation.