


Gold has staged a solid recovery from the 4400 region, but the structure of the move suggests caution rather than renewed bullish momentum. The advance from the lows appears to be unfolding in a three-wave pattern, which is typically corrective in nature rather than impulsive. Price has also reached the 78.6% Fibonacci retracement level, an area often associated with strong resistance and potential trend continuation to the downside.
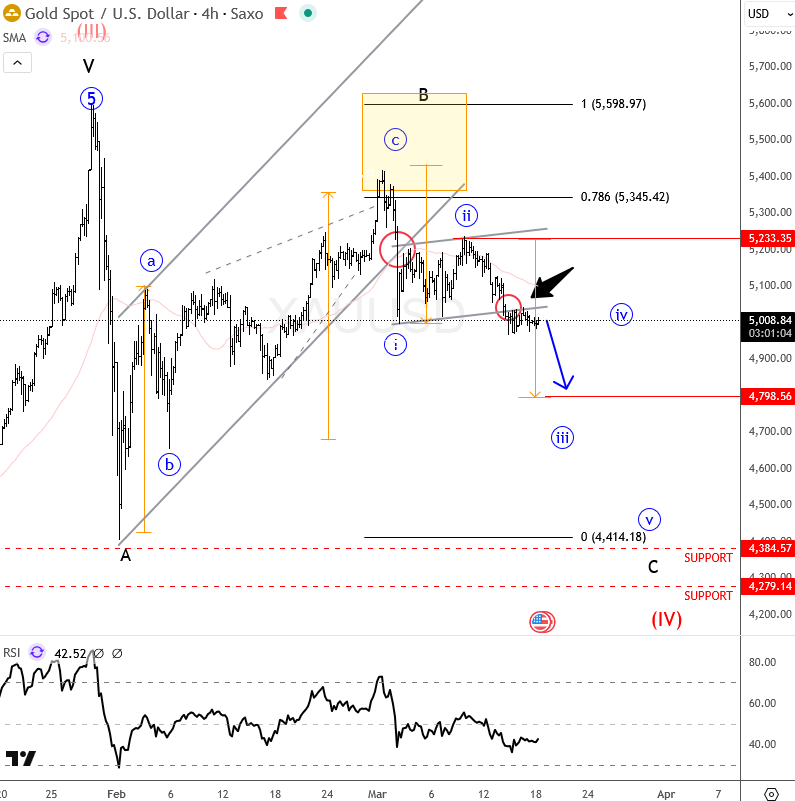
XAUUSD(gold) 4H Chart
In recent weeks, the market has delivered a notable technical signal by breaking below a key trendline support. This shift in structure indicates that the prior bullish trend has likely weakened, opening the door for further downside pressure. Additionally, the smaller corrective channel, interpreted as a wave two formation, has now been breached. This breakdown increases the probability that a stronger third wave decline is beginning to unfold.
If this bearish wave scenario plays out, the next leg lower could be sharp and impulsive, with downside targets potentially extending toward the 4800 region.
From a broader perspective, the price action since the January highs continues to support the idea that a higher-degree wave four correction is in progress. This suggests that the current environment is more consistent with consolidation and downside exploration rather than the start of a new bullish cycle.
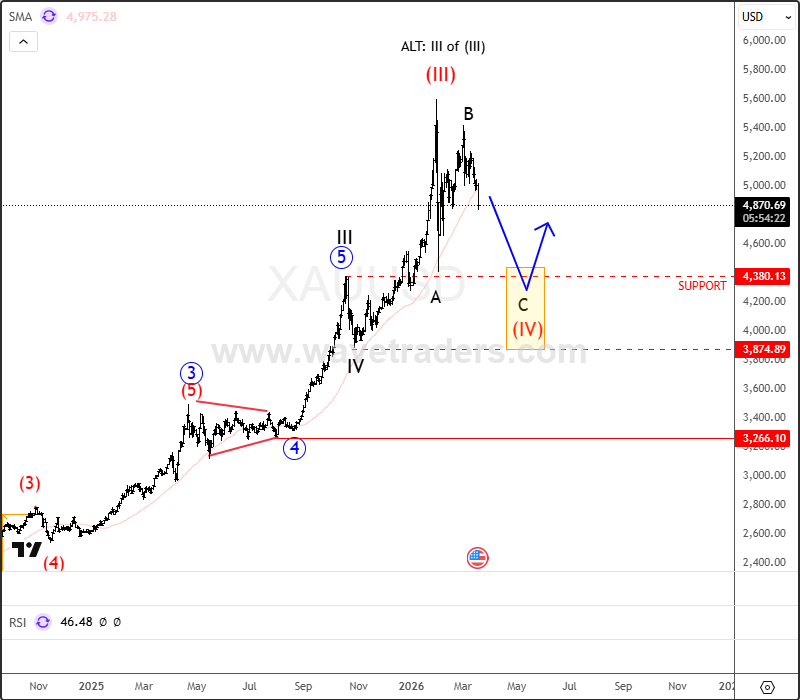
XAUUSD(gold) Daily Chart
Looking at higher time frame charts, there is a significant support zone between 4000 and 4300. This area may act as a key downside target and potential stabilization zone if selling pressure accelerates in the coming sessions.
Overall, while the short-term recovery may have offered temporary relief, the underlying structure still favors a continuation lower, with increasing momentum likely if key support levels continue to give way.



Comments
Log in or sign up to join the conversation.