

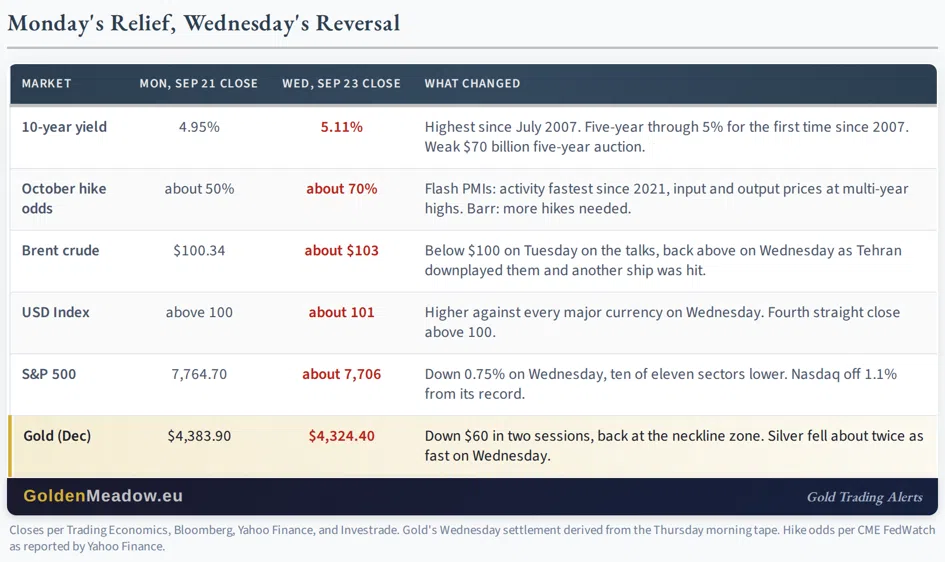
The 10-year yield closed Wednesday at 5.11 percent, its highest since July 2007.
The five-year crossed 5 percent for the first time since 2007, and October's hike is now priced at about 70 percent after the flash PMIs showed the fastest business activity since 2021 with input and output prices at multi-year highs. Governor Barr said more hikes are needed. Brent settled near $103, the dollar rose against every major currency, and gold settled at $4,324.40, down $52 on the day and $60 in two sessions.
This morning is quiet: gold near $4,320, silver and copper slightly lower, futures down a third of a percent, Xi Jinping landing in Washington. The quiet is the market waiting to see whether the neckline holds a daily close.
Two Sessions
On Monday, I wrote that oil's retreat had pulled yields down and lifted stocks, and that gold "got $30 of that and is handing it back." It has now handed back $60, and the rest of Monday's relief has gone with it. The 10-year is 16 basis points higher than it was Monday evening, the S&P 500 is below where it closed that day, Brent is back above $100, and October's hike went from a coin flip to 70 percent. The reversal took two sessions and one PMI.
In my yesterday’s Gold Trading Alert, I wrote that the two-year is "the one number in this alert that the peace headlines do not move." It closed at a cycle high, and the five-year followed it through 5 percent on a weak auction.
Gold: On The Line
Gold's $4,324.40 settlement is in the zone of the declining neckline, and the chart will decide whether Wednesday's close was on it or through it. Silver price fell about twice as fast as gold on Wednesday, as it did on the way down last week, and the miners gave back their "strength" on the day I described it as the 2012 kind. A daily close below the neckline completes the pattern, with its target below $4,000, and the dollar's fourth close above 100 is the setup for it.
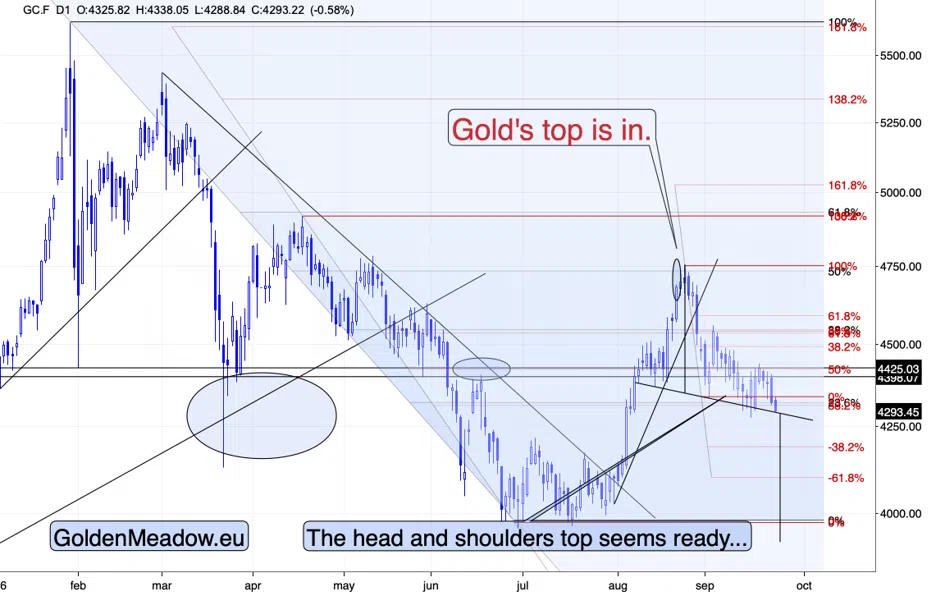
After falling significantly yesterday, gold price declined some more today, but the thing that I’d like to point your attention to is the fact that there’s one thing that is already different now vs. last week. Namely, there are no bullish intraday reversals this time.
Also, yesterday’s close was the lowest close since early August. And gold keeps falling.
Both confirm the bearish case, and the USD index is likely to provide fuel to the bearish fire.
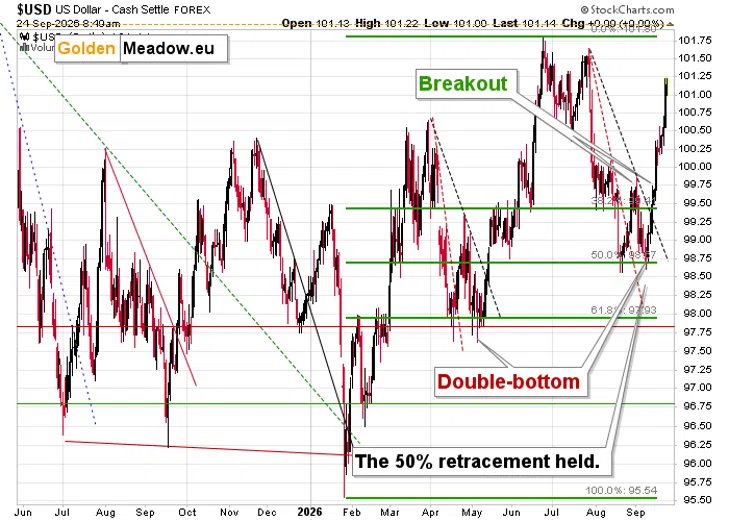
I’ve been writing about USD’s bullish potential for some time now, and if you’ve been following my analyses, this rally comes as no surprise to you. The question remains:
Is there really no stopping the bullish USD train?
Let’s face it – there will be corrections along the way. And we might get one when the USD Index moves close to its previous 2026 highs at about 101.5 – 101.8. The point, however, is…
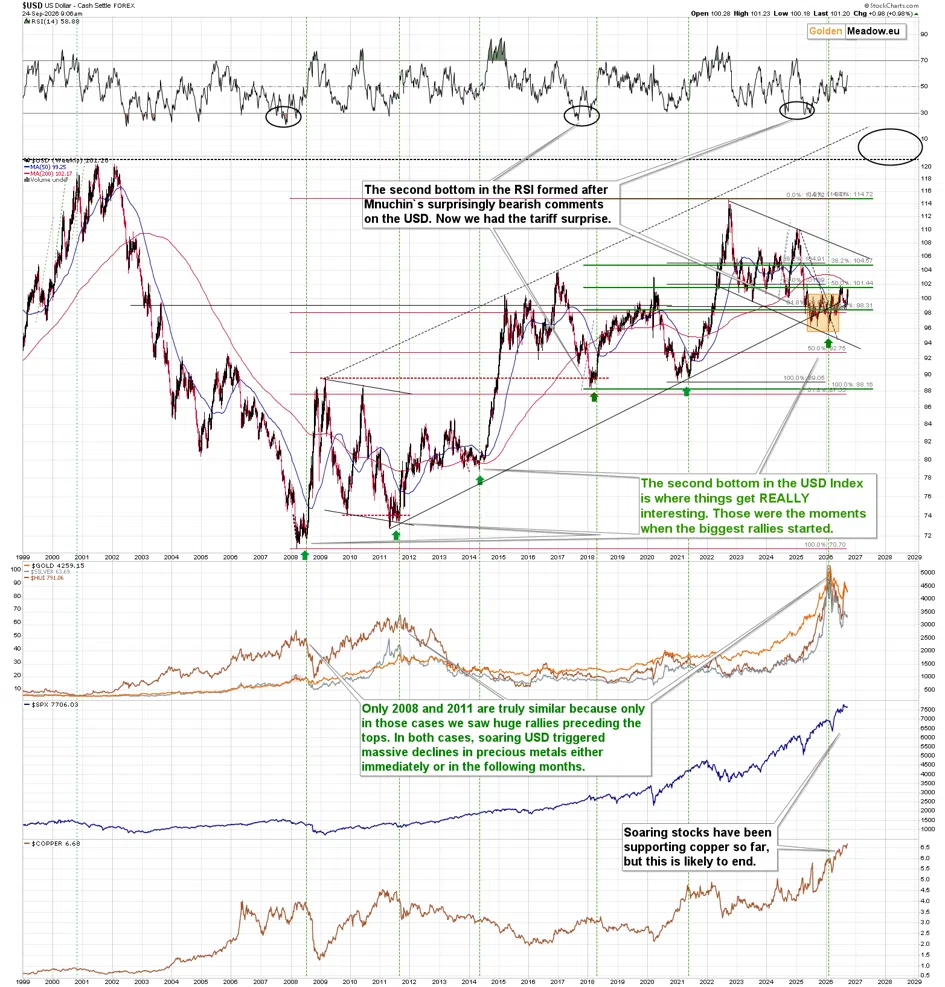
The point is that this is not a short-term rally. It’s either a medium- or a long-term rally in the USD Index.
The USDX once again held above the rising, long-term support line despite several attempts to move below it.
How many times have you read that the USD is trash because of twin deficits, Fed’s approach, US political situation, inflation, and so on and so forth?
Probably more than you care to count.
And yet – the chart doesn’t lie. The USD Index has been on the rise since 2008.
For almost 20 years!
The big trend here is up, and the USD Index is now starting to rally from the lower border of the broad trading channel. This is an exceptionally bullish long-term setup and one that other markets won’t be able to ignore.
The base for the rally was huge – bigger than the previous ones. And I wrote about it when it formed – in my gold price forecast for September 2026, I warned that this “breakdown” was really a bottoming process and that this was bullish, not bearish. We previously had broad bottoms that usually took the form of double bottoms. This time, it was a multi-bottom, which means that the implications are even more bullish.
Please consider what happened after the final bottoms of the previous broad bottoms – I marked those cases with green arrows and green, dashed lines. The USD Index soared in all those cases, and I think we’ll see the same thing also this time.
Implications for precious metals used to be either bearish or extremely bearish. Right now, we’re very likely in the latter type of analogy. The reason is that right now we’re after a powerful rally and a major top and this is what we saw only two times in the past years – in 2008 and in 2011-2012. When the USD Index soared – from a broad bottom – then the precious metals (and copper) truly plunged.
This time, copper has support of rising stocks, but this is likely to end as well.
· Higher USD makes U.S. exports less competitive.
· High rates make credit more expensive (not to mention the burden of the higher mortgage payments).
· And higher oil – I don’t think I need to explain this one.
The geopolitical situation continues to support higher oil and higher USD, so those technicals don’t work in isolation.

Comments
Log in or sign up to join the conversation.