
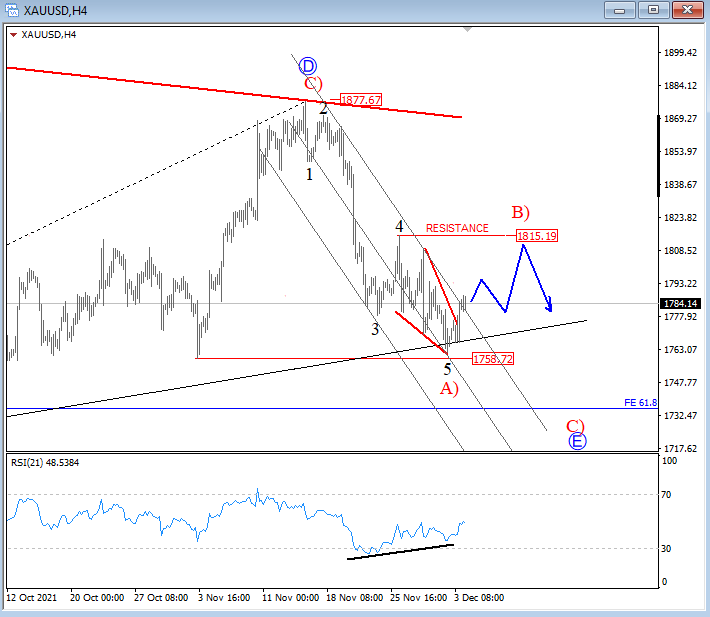
Gold came sharply down on 4h chart, clearly with five waves to 1750-1760 area where metal found some support which has been expected based on divergence and ending diagonal in a fifth wave. As such, we assume that wave A) is finished and that market is headed higher for wave B). Nice resistance for a next sell-off is at 1815.

Image Source: Pixabay
Gold 4h Elliott Wave Analysis
(Click on image to enlarge)
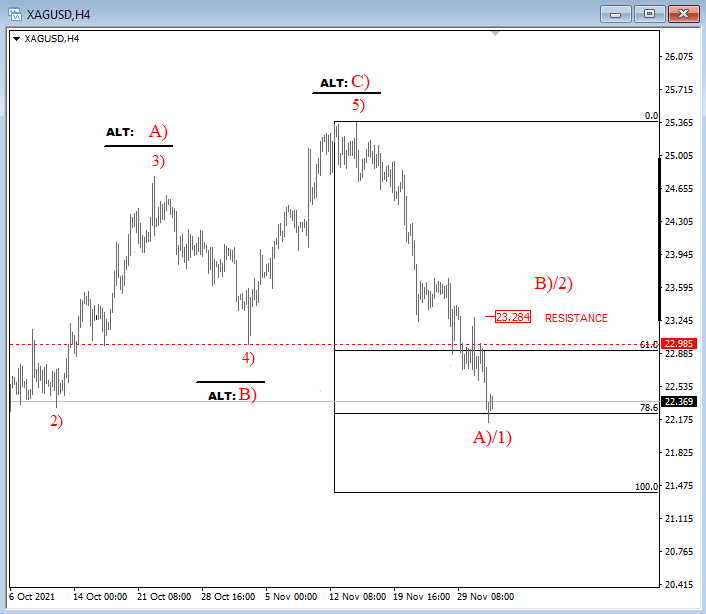
Silver is coming down on the 4h time frame from 25.40 resistance, much more than we thought, so it appears that metal is in a higher degree three-wave drop. Ideally, that will be an A)-B)-C) decline, either a corrective one down to 22-21 support zone or maybe even back to September lows as part of the final leg of an ending diagonal pattern as shown on daily ALTernate count. Wave A) can be now approaching the end, so after a pullback in wave B) with resistance around 23.70 level, watch out for more weakness within wave C).
Silver 4h Elliott Wave Analysis
(Click on image to enlarge)


Comments
Log in or sign up to join the conversation.