

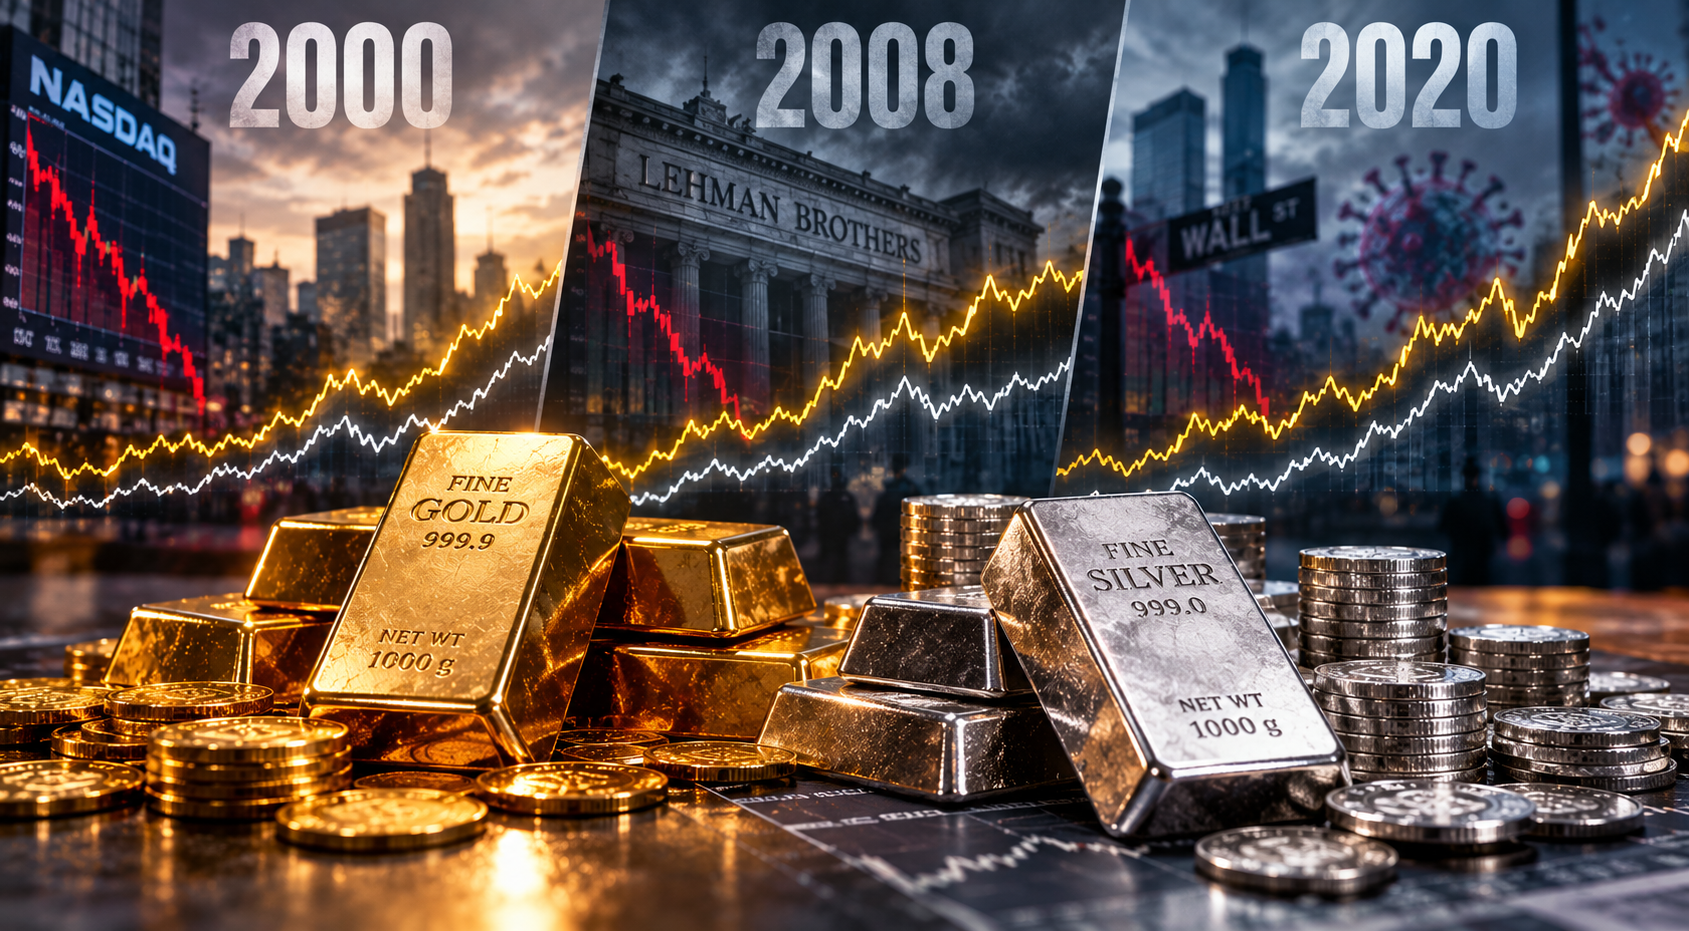
Gold and silver have historically shown significant volatility during periods of heightened economic uncertainty, although generally less than the broader stock market. The dot-com bust in 2000, the Global Financial Crisis in 2008, and the COVID-19 recession in 2020 provide three notable examples. Comparing both metals across these three downturns shows how their prices fared over the first 24 months. The pattern is interesting, but with only three episodes and different conditions in each, it shouldn't be treated as a reliable prediction of how they would perform in the next downturn.
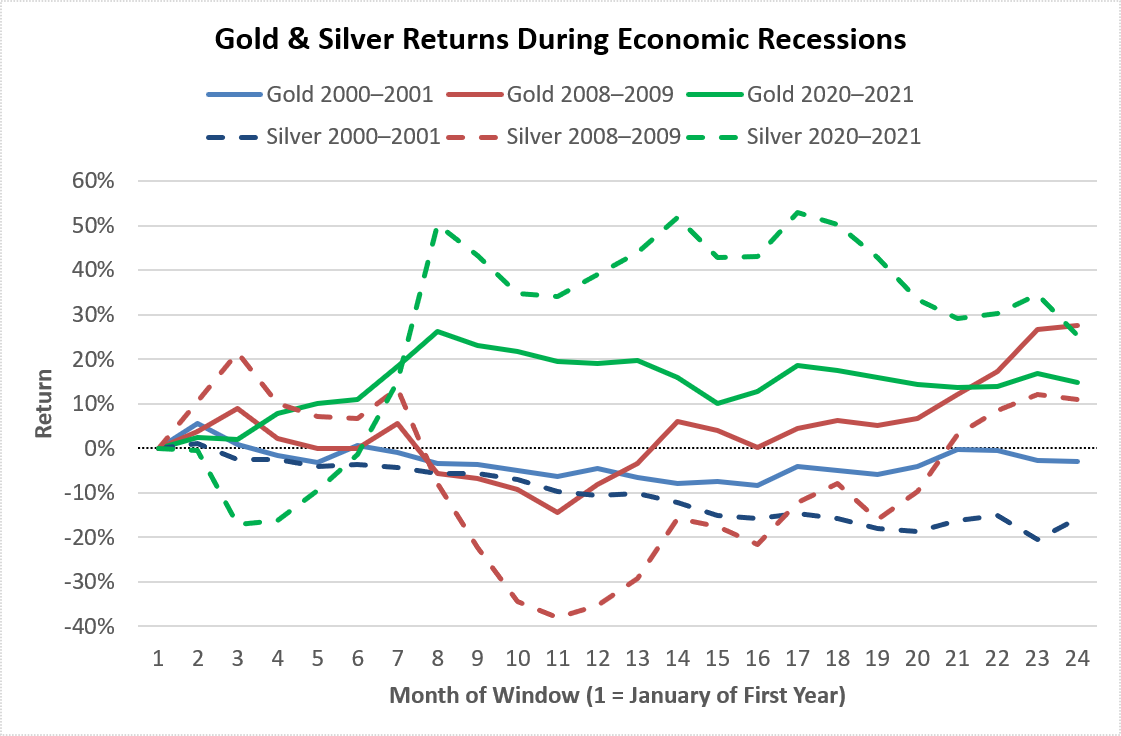
Source: World Bank, IndexMuni; Data is Month-over-Month
This graph was produced by Lucas Juery, CFA, CFPⓇ and is not intended to provide financial advice.


Comments
Log in or sign up to join the conversation.