

General Motors Company (GM) is engaged in the designing, manufacturing and retailing of vehicles globally including passenger cars, crossover vehicles, and light trucks, sport utility vehicles, vans and other vehicles. GM and its partners produce vehicles in 30 countries, and the company has leadership positions in the world's largest and fastest-growing automotive markets. GM’s brands include Chevrolet and Cadillac, as well as Baojun, Buick, GMC, Holden, Daewoo, Jiefang, Opel, Vauxhall and Wuling.Its business is organized into three geographically-based segments- General Motors North America (GMNA), General Motors International Operations (GMIO) and General Motors Europe (GME). General Motors Company is headquartered in Detroit, Michigan, the United States of America.
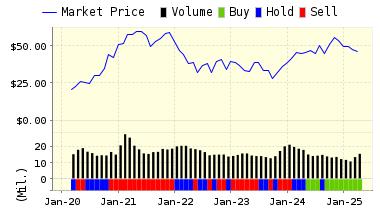
We make it three for three this week with big companies reporting Q1 results in our bulletins. General Motors was propped up by the government during the financial crisis to much criticism from some circles- (hello, Mitt Romney). But clearly, the company is back from the dead with share prices trading in the $30-40 range for the past 18 months or so.
However, the Q1 results, reported today, indicate that outside events can still harm the company's profitability. Despite strong sales in the US and China, the company reported weaker than expected profits due to the strong dollar. Losses in Europe and South America hurt what was otherwise a strong quarter--with profits increasing year-over-year. Results of $0.86/share--before a special item loss of 0.36/share--were significantly below consensus estimates of $0.97/share.
In a company press release, GM CEO Mary Barra noted that “our results in the first quarter provide a solid foundation to achieve our financial commitments for the year. Continued execution of our plan, including our capital allocation framework, will drive profitable growth, return on invested capital and shareholder value.”
The company has benefitted from low fuel prices as its larger, gas-guzzling trucks and SUVs are more palatable when one doesn't go broke keeping the tank full. Those vehicles are generally more profitable, so the bottom line is bolstered when they are in favor among consumers. But good performance for a giant company like GM needs to be across the board for profits to match potential.
It will take a few days for analysts to update the earnings estimates based on the new data, so we may see some fluctuation in our forecast and valuation figures. Also, the company shares dropped on the news of the miss, so the models may find the stock even more attractive on a valuation basis if everything else remains the same.
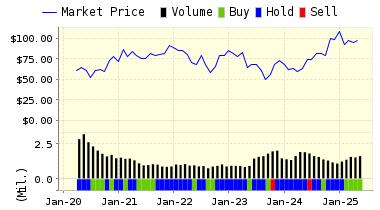
ValuEngine continues its STRONG BUY recommendation on General Motors for 2015-04-22. Based on the information we have gathered and our resulting research, we feel that GM has the probability to OUTPERFORM average market performance for the next year. The company exhibits ATTRACTIVE Company Size and P/E Ratio.
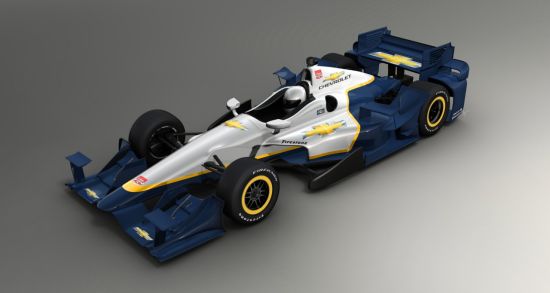
GM Chevrolet-Powered 2015 Indy Car with Chevy-Developed Aero Kit-- Photo ©General Motors
Below is today's data on GM:
|
ValuEngine Forecast |
||
|
Target |
Expected |
|
|---|---|---|
|
1-Month |
37.56 | 1.08% |
|
3-Month |
38.03 | 2.34% |
|
6-Month |
39.19 | 5.46% |
|
1-Year |
41.97 | 12.93% |
|
2-Year |
38.83 | 4.51% |
|
3-Year |
34.00 | -8.50% |
|
Valuation & Rankings |
|||
|
Valuation |
1.46% overvalued |
Valuation Rank(?) |
 58 58 |
|
1-M Forecast Return |
1.08% |
1-M Forecast Return Rank |
98 |
|
12-M Return |
8.56% |
Momentum Rank(?) |
65 |
|
Sharpe Ratio |
0.07 |
Sharpe Ratio Rank(?) |
50 |
|
5-Y Avg Annual Return |
2.13% |
5-Y Avg Annual Rtn Rank |
50 |
|
Volatility |
29.98% |
Volatility Rank(?) |
60 |
|
Expected EPS Growth |
27.03% |
EPS Growth Rank(?) |
65 |
|
Market Cap (billions) |
59.71 |
Size Rank |
99 |
|
Trailing P/E Ratio |
10.04 |
Trailing P/E Rank(?) |
94 |
|
Forward P/E Ratio |
7.91 |
Forward P/E Ratio Rank |
95 |
|
PEG Ratio |
0.37 |
PEG Ratio Rank |
71 |
|
Price/Sales |
0.38 |
Price/Sales Rank(?) |
88 |
|
Market/Book |
2.02 |
Market/Book Rank(?) |
54 |
|
Beta |
1.70 |
Beta Rank |
18 |
|
Alpha |
-0.08 |
Alpha Rank |
|
VALUATION WATCH: Overvalued stocks now make up 60.7% of our stocks assigned a valuation and 22.44% of those equities are calculated to be overvalued by 20% or more. Thirteen sectors are calculated to be overvalued--with five at or near double digits.
Comments
Log in or sign up to join the conversation.