

Based upon projections for 2017, it would appear as if the global bond markets have once again surpassed expectations. Indeed, following the U.S. election and the subsequent rate hike by the Federal Reserve (Fed) in December, the “student body right” mentality among investors was that the fixed income asset class could have its share of difficulties in 2017. While it is certainly early (and as we have seen in the past, developments can change over the course of a full year), the first three months of this year have been a welcome surprise for fixed income investors.
The emerging market (EM) debt space had experienced the best performance within the fixed income universe during the first quarter, continuing to build on the positive momentum seen in 2016. To be sure, EM local debt produced a total return of +6.50% (J.P. Morgan Government Bond Index – Emerging Markets Global Diversified Index) in the first quarter, after posting a nearly +10% figure for all of last year. Some of the key reasons behind this performance in the opening three months of the year have been fundamental improvements in EM countries combined with a less hostile U.S. rate setting. Although the Fed lifted rates in March and has discussed balance sheet normalization, Treasury yields have actually been range-bound at worst, helping to support the EM local debt arena, accordingly. Looking ahead for the second quarter, EM debt has a poor historical track record in May, which suggests some caution, but any setback in a range-bound rate environment could be viewed as a long-term buying opportunity.
Total Returns
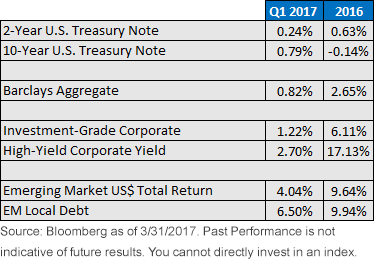
The U.S. corporate bond market managed to come in on the plus side of the ledger as well in the first quarter, although the returns have paled compared with last year’s experience. This should come as no surprise to fixed income investors, however, as calendar year 2016 represented a stellar performance for both the investment-grade (IG) and high-yield (HY) sectors. To provide some perspective, as measured by the Barclays U.S. Corporate High Yield Total Return Index Unhedged, HY produced a positive reading of +2.70% during the first quarter following a very robust increase of +17.13% in 2016. Within the IG corporate market, according to the Barclays U.S. Aggregate Corporate Total Return Value Unhedged Index, the IG sector registered a first-quarter gain of +1.22% after finishing 2016 with a positive performance of +6.11%.
Perhaps the biggest surprise in the fixed income arena has been within the interest-sensitive side, specifically the U.S. Treasury market (UST). Although the Fed implemented another rate hike in mid-March (three months sooner than market expectations to begin the year), UST yields have exhibited a range-bound pattern, and in the case of the 10-Year maturity, the yield had actually fallen nearly 25 basis points (bps) from its pre-March Federal Open Market Committee high watermark through quarter-end on March 31. The 2-Year yield followed a similar trend, dropping nearly 15 bps during the aforementioned time frame. As a result, these UST returns also managed to record positive performances in the first quarter of +0.24% and +0.79% for the 2-Year and 10-year (utilizing the Citi 2-Year and 10-Year Treasury Benchmark On-the-Run Index), respectively.
Conclusion
Where do we go from here in 2017? Well, fixed income investors have certainly digested a lot of market-related news already, but things could be just beginning to heat up as spring turns to summer. Geopolitical headlines continue to hover over the money and bond markets. Last weekend’s French presidential election results provided a clear-cut example of the risk-on (Macron wins)/risk-off (Le Pen) wins) dynamic while saber-rattling from the Korean peninsula will more than likely also garner its fair share of headlines. That being said, developments in Washington, D.C., will no doubt carry the potential to move fixed income yields in a visible way, as the tax reform/tax cut debate and the Fed’s monetary policy decisions (Fed Funds Rate and balance sheet) move front and center on traders’ screens.
Unless otherwise noted, source is Bloomberg, as of March 31, 2017.



Comments
Log in or sign up to join the conversation.