

Oil prices continued to drop over the course of the last few weeks. The cause for the initial drop of over 30% on March 9, which was the sharpest drop in Oil prices since 1991, came from Saudi Arabia-led OPEC and Russia failing to agree on deeper production cuts in response to the spread of the coronavirus which has hit the global economy and its demand for oil.
In fact, Saudi Arabia made a very aggressive step towards a price war, by slashing official selling prices of its oil to the US, Europe and Asia by as much as $8 a barrel.
And given the difficulty to estimate the impact of the Coronavirus and resulting economic shutdown around the globe will have since no one really knows how long it will take, WTI Oil hasn't yet recovered from this drop, instead continuing to drop even further, currently eyeing the important mark of 20 USD/Barrel.
And even if WTI Oil has fallen more than 65% from its 2020 yearly highs around 65.50 USD, an even deeper drop seems very likely.
No demand despite massive price discounts from Saudi Arabia
Over the course of last week, rumours began to spread that despite the massive discounts Saudi Arabia is offering right now, European and US buyers refuse to buy oil in larger amounts.
The US, in particular, refusing to buy may surprise after US president Trump publicly announced the US Strategic Petroleum Reserve (SPR) to purchase oil on March 13.
Last Wednesday, the US announced that it cancels its plan to add to its strategic reserves after the $2 trillion stimulus package from the US showed that the requested $3 billion in funding for the project was left out.
Given the current uncertain economic environment and the missing demand from the US SPR, a drop below 20 USD and further bearish momentum seems only a question of time.
How to trade WTI Crude Oil in this environment?
A first target on the downside could be seen around 17.00/50 USD, below and with rising uncertainty the Coronavirus-based economic shutdown might have on the global economy, a drop as low as 10 USD into the region of the 1998/1999 lows seems possible:
(Click on image to enlarge)
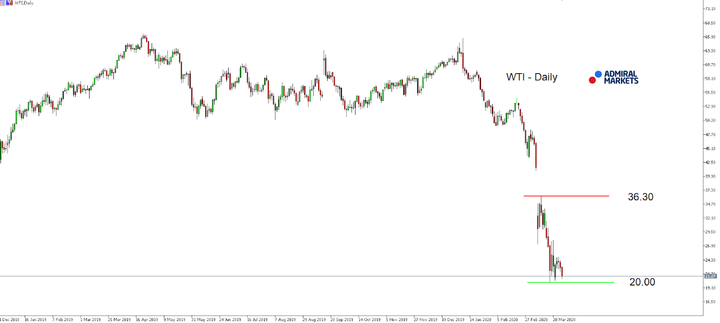
Source: Admiral Markets MT5 with MT5-SE Add-on WTI Daily chart (between December 21, 2018, to March 27, 2020). Accessed: March 27, 2020, at 07:30pm GMT - Please note: Past performance is not a reliable indicator of future results, or future performance.
If you plan to position yourself with the bearish momentum, you probably should go with the device "Sell the bounce" where you switch to a lower time-frame like H1, identify a sequence of falling highs and lows and position yourself after a re-test of former lows, placing your stop at the last recent relative high:
(Click on image to enlarge)
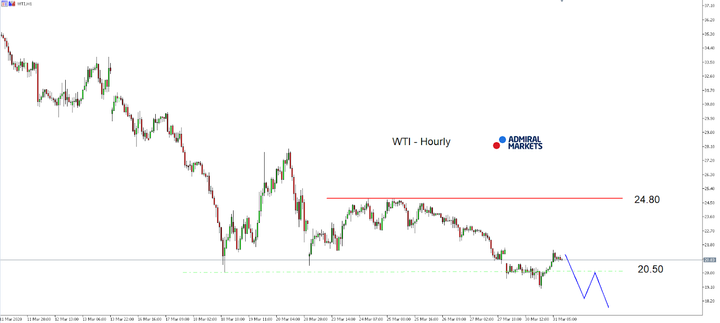
Source: Admiral Markets MT5 with MT5-SE Add-on WTI Daily chart (between March 11, 2020, to March 31, 2020). Accessed: March 31, 2020, at 07:00 AM GMT
In 2015, the value of WTI fell by 31.1%, in 2016, it rose by 42.8%, in 2017, it increased by 11.5%, in 2018, it fell by 24.6%, in 2019, it increased by 33.3%, meaning that after five years, it was up by 13.6%.



Comments
Log in or sign up to join the conversation.