
Whilst the market waits for the important release of the NFP and unemployment rate from the US tomorrow, we continue to see macroeconomic data from Germany that is not positive.
Over the past few months, we have witnessed a deterioration in macroeconomic data globally - including from the US, China and Germany. Germany is the engine of the Eurozone; thus, its economic situation affects the economies of the rest of Europe. It is, therefore, very important to always keep an eye on the macroeconomic data from this European power.
Last week, we saw that both the unemployment rate and the preliminary PMI data in Germany were worse than expected by the market consensus. Whilst the PMI of the services sector has been reported slightly better than the preliminary data, it is still much lower than the previous month's data.
During yesterday's session we learned that German factory orders fell by 7.7% when they were expected to fall by 2.1%. This is not only worse than expected, but it has also pushed this indicator into negative territory from the previous month's positive figure of 4.9%.
In addition, today we have learnt that the industrial production index has also gone from growing by 1.3% to losing 4%, also exceeding market expectations which had expected a reduction of just 0.4%.
All this macroeconomic data continues to show weakness in future expectations and these may be even further negatively affected due to the energy crisis, which looks set to harden as winter approaches in Europe. This crisis is possibly the black swan that the markets have been expecting with sharp rises in energy prices.
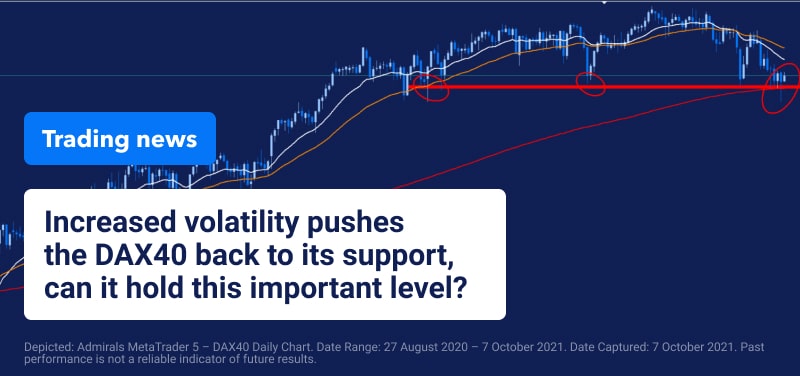
If we focus on the DAX40, we can see that, with the increase in volatility reflected in the ATR indicator, currently the price is once again at its important support level represented by the red band and the 200-session moving average.
(Click on image to enlarge)
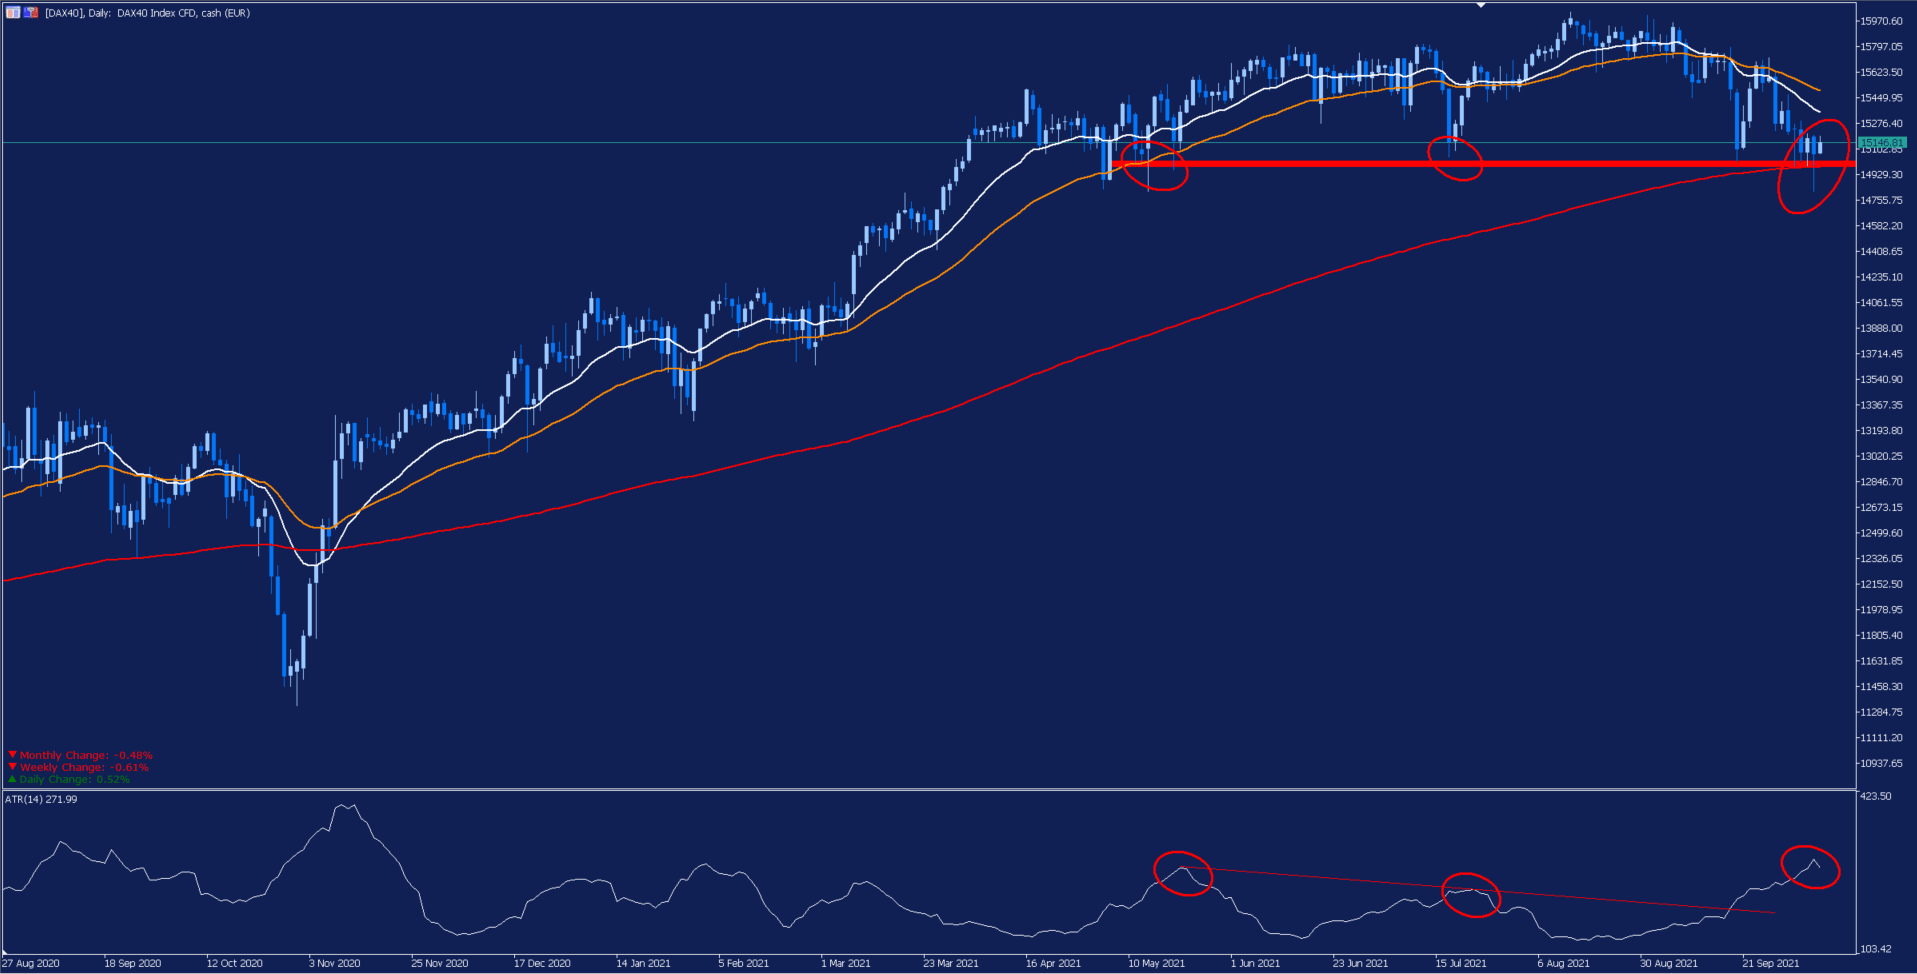
Depicted: Admirals MetaTrader 5 – DAX40 Daily Chart. Date Range: 27 August 2020 – 7 October 2021. Date Captured: 7 October 2021. Past performance is not a reliable indicator of future results.
As we can see in the following chart, after making record highs the DAX40 started a correction that has led it not only to lose the long-term uptrend line, but also to lose several support levels causing a bearish crossover of both its MACD indicator and short and medium-term averages. The loss of this important support level could open the door to a possible trend reversal which could lead to a major reversal.
Therefore, we will have to be very attentive to the evolution of the price in the coming sessions, given that if volatility continues to increase, the probabilities of breaking this level will increase.
In contrast, if it finally manages to hold this important support level, we could find ourselves with a rebound in search of its 18-session moving average and the orange band that act as the main resistance for the moment.
(Click on image to enlarge)
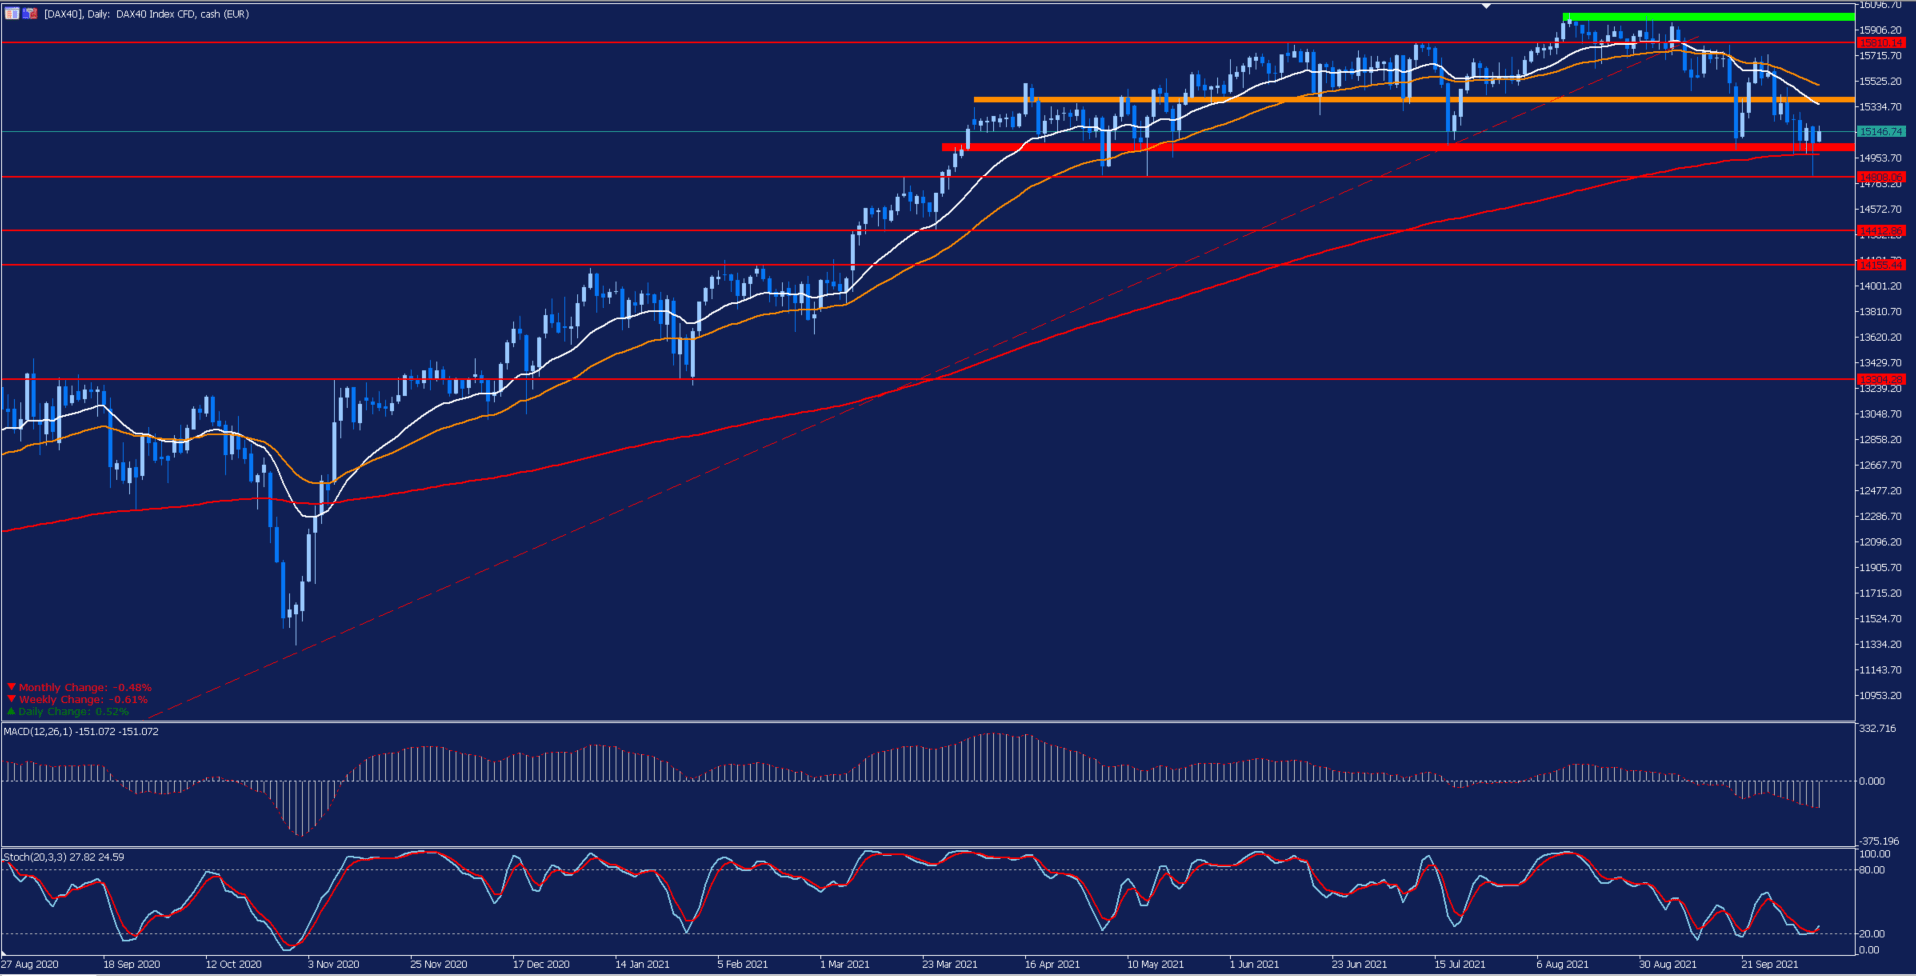
Depicted: Admirals MetaTrader 5 – DAX40 Daily Chart. Date Range: 27 August 2020 – 7 October 2021. Date Captured: 7 October 2021. Past performance is not a reliable indicator of future results.
Evolution of the last five years:
- 2020: 3.6%
- 2019: 25.48%
- 2018: -18.26%
- 2017: 12.51%
- 2016: 6.87%


Comments
Log in or sign up to join the conversation.