
While the market is mainly focused on the upcoming ECB meeting on Thursday, today saw the release of important macroeconomic data for both Germany and the Eurozone as a whole.

According to the Eurozone’s preliminary GDP data, during the second quarter the economy grew more than expected, with GDP increasing by 2.2% - as opposed to the 2% anticipated. Year-on-year GDP growth came in at 14.3% versus the 13.6% expected.
In Germany, the industrial production and confidence data has been published by the German ZEW. The only positive data in the report is related to industrial production in July, which increased by 1% against the 0.9% expected.
Despite this, the data that interests us the most, and that could have the greatest impact in the future, is the data related to investor confidence. For the fourth consecutive month, German investor confidence is not only lower than the previous month's figure, but also worse than expected by the analysts' consensus.
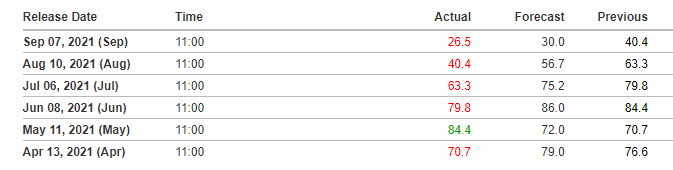
Source: investing.com
The ZEW current sentiment index was also negative for the second month in a row. So, although the overall trend remains positive, as we have highlighted in previous analyses, the German economy is showing signs of slowing down.
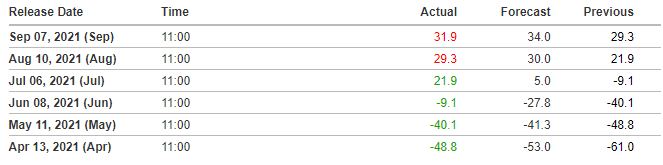
Source: investing.com
This data shows, once again, that confidence in the future of the economy is deteriorating. The economy is currently being maintained by the measures implemented by central banks, so a possible start to tapering in the US or Europe could cause problems for financial markets and the recovery. Therefore, we will have to keep an eye on the outcome of the ECB meeting on Thursday, although for the moment it is not expected to take action and once again follow the Fed's lead.
If we focus on the German DAX30, we can see that, during the last few months, it has maintained a clear upward trend that led it to set new historical highs in mid-August. These highs were set after the price overcame the sideways movement it had been following since June, after twice breaking above the uptrend line as we can see in the areas marked by the circles on the daily chart below.
(Click on image to enlarge)
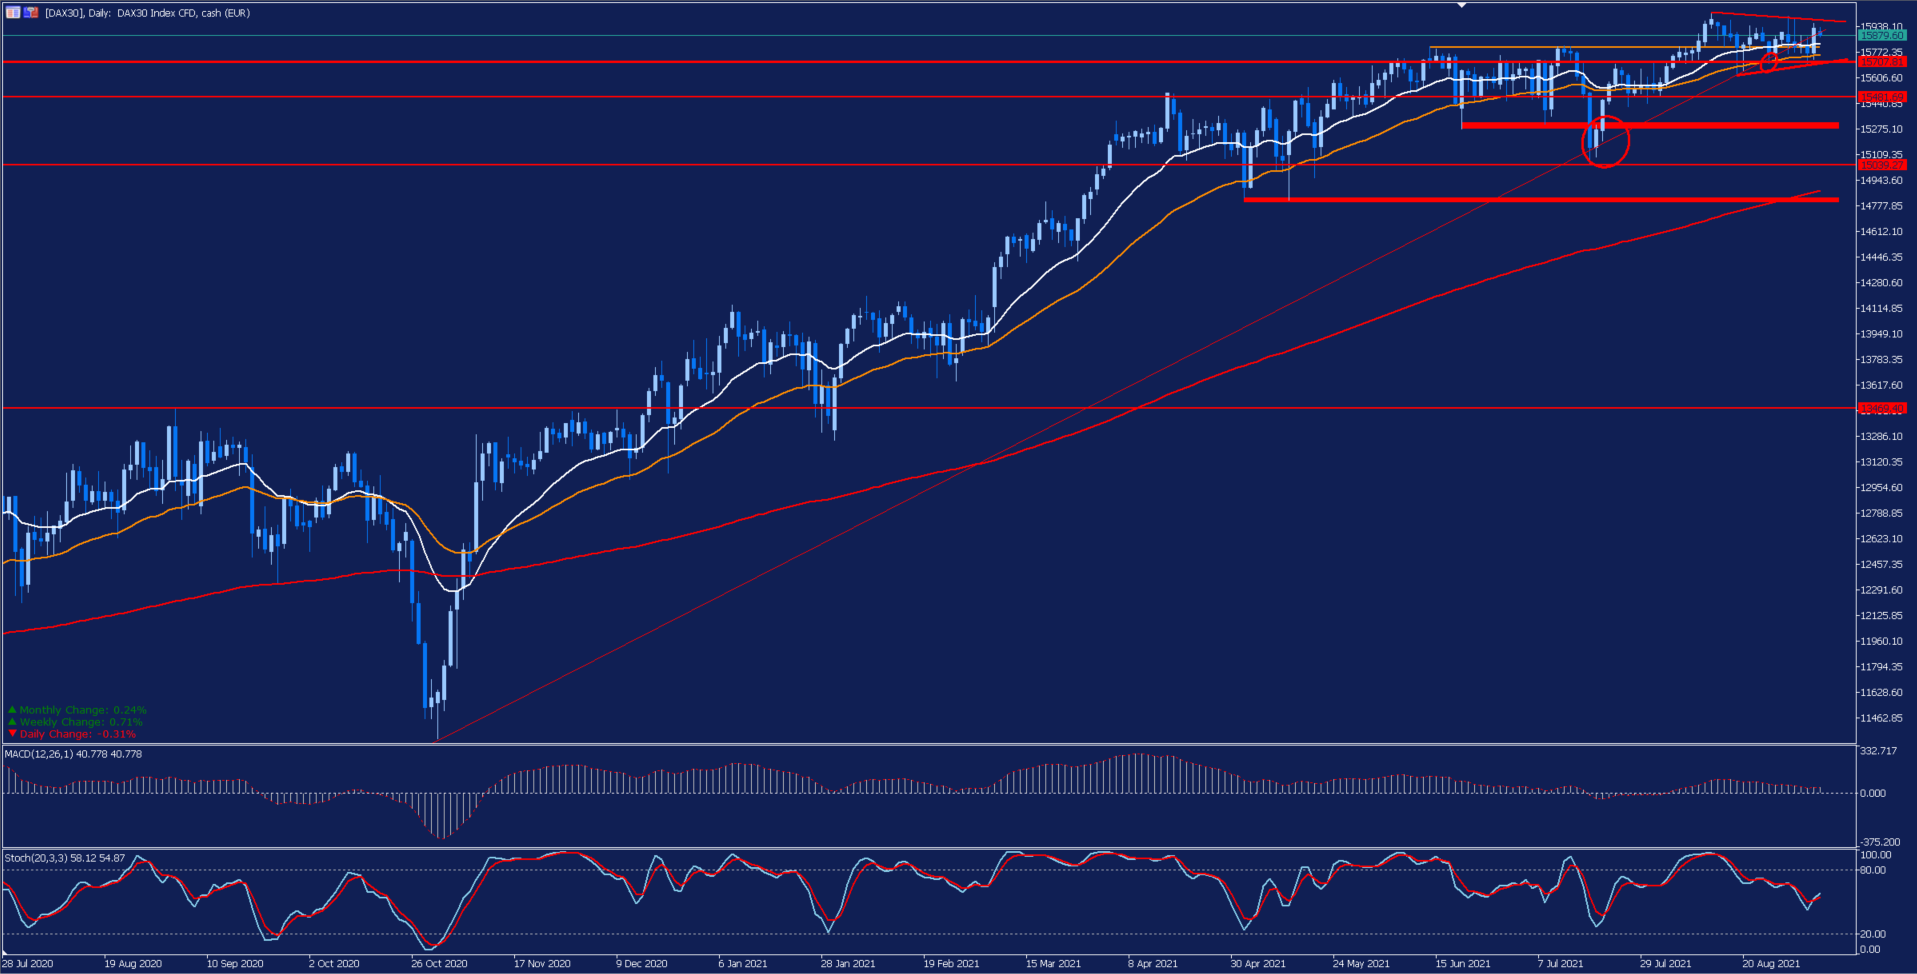
Depicted: Admirals MetaTrader 5 – DAX30 Daily Chart. Date Range: 28 July 2020 – 7 September 2021. Date Captured: 7 September 2021. Past performance is not a reliable indicator of future results.
Currently, we can observe that the DAX30 is undergoing a triangular consolidation formation - in which the price is fighting to maintain its 18-session moving average in white and its support/resistance level represented by the orange band, after losing its long-term uptrend line.
The definitive loss of these supports could possibly open the door to a larger pullback that could target the lows of the sideways range in the red band - which we can see in the H4 chart below.
Alternatively, if the price manages not only to hold these supports, but also to break this triangular formation to the upside, we could see a new bullish surge that could set new all-time highs.
(Click on image to enlarge)
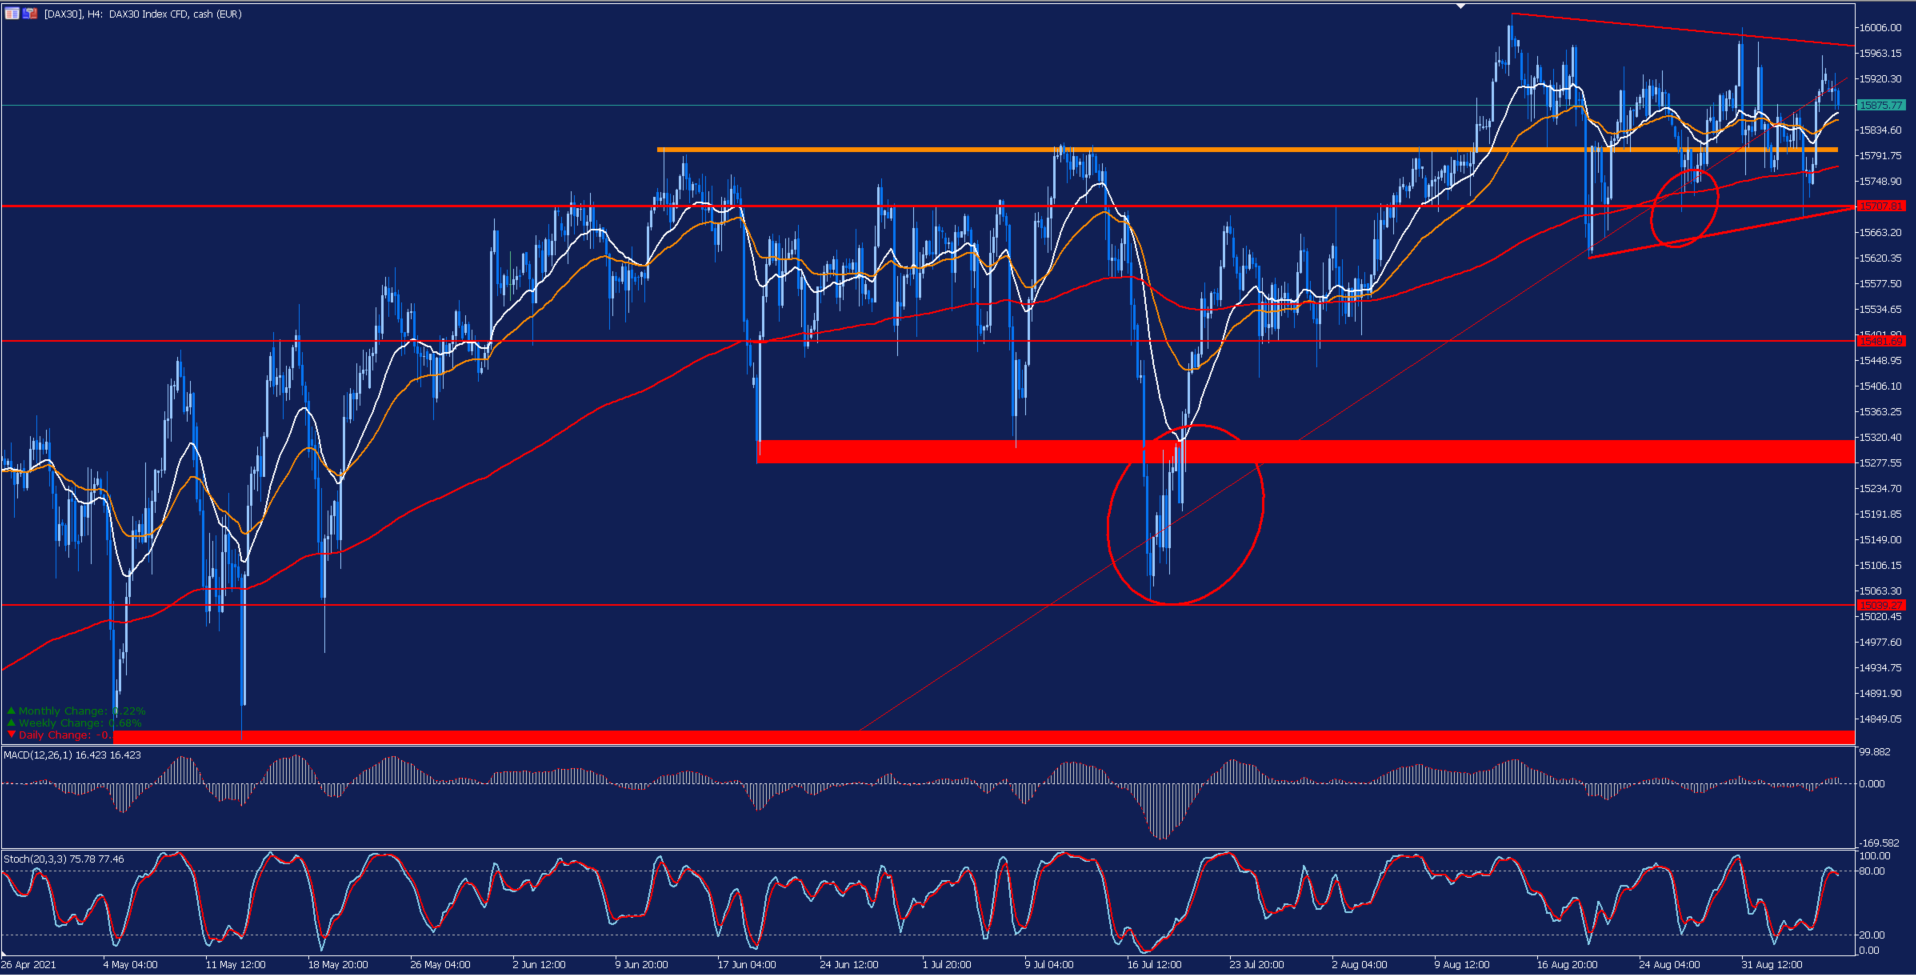
Depicted: Admirals MetaTrader 5 – DAX30 H4 Chart. Date Range: 26 April 2021 – 7 September 2021. Date Captured: 7 September 2021. Past performance is not a reliable indicator of future results.
Evolution of the last five years:
- 2020: 3.6%
- 2019: 25.48%
- 2018: -18.26%
- 2017: 12.51%
- 2016: 6.87%


Comments
Log in or sign up to join the conversation.