
Despite the constant news flow and tweets discussing tariffs on Mexican imports, the S&P 500 (SPX) and peer indices all rallied sharply this past week. The Dow (DJIA) jumped 4.7%, its biggest weekly gain since November. It also snapped a six-week losing streak. The S&P 500 and Nasdaq (NDX) were up 4.4% and 3.9% this week, respectively.
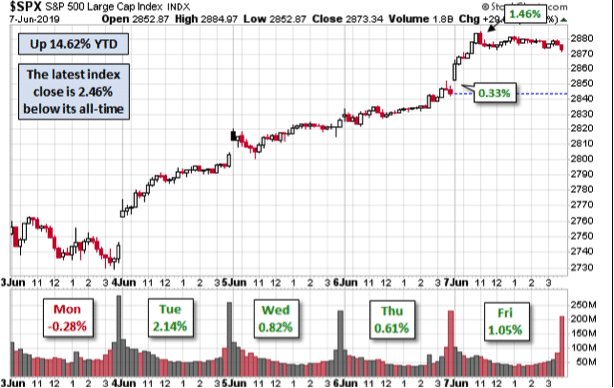
It can certainly be suggested that with such a binary potential outcome from the threat of 5% tariffs on all Mexican imports looming over the markets, not many predicted the major averages rallying for the week. Nonetheless, that is exactly what happened. If asking yourself, “Why, why would the markets rally”, you’re probably not alone in asking that question. The answer could be rationalized for simplicity in that the FOMC/Fed is the greatest backstop for the market as has been proven for many decades gone by and most recently during the Great Financial Crisis (GFC). Think of it this way: The GFC, if left to its own devices and without Fed intervention, would likely have found the U.S. economy faltering for at least the next couple of years. It is likely that it would prove to sink the global economy and produce a protracted global recession like nobody had ever witnessed. And so the Fed stepped in with Quantitative Easing and the Government stepped in with T.A.R.P. So when the Fed began shifting its message as the economic data had proven to weaken this past week (not contract but weaken) with increased tariff threats came to the forefront, investors became increasingly sanguine regarding the threats to the market and economy. Too sanguine? Only time will tell.
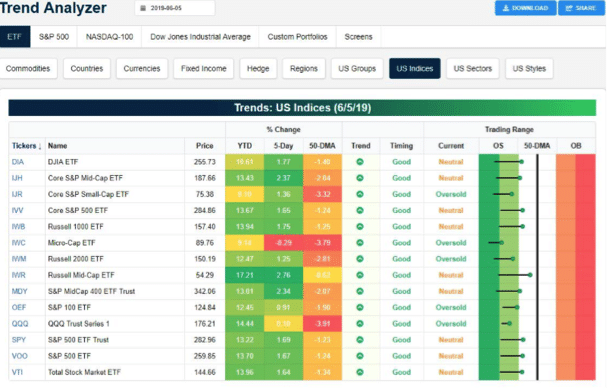
With the strong rally that took place this past week, most major index ETFs have moved from Oversold territory back to Neutral territory. According to the Bespoke Trend Analyzer, five index ETFs still remain oversold.
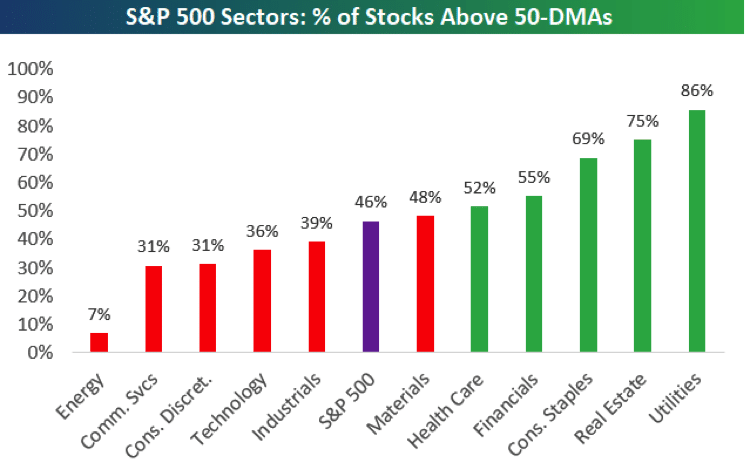
In addition to the index ETFs moving back toward and into Neutral territory, 46% of S&P 500 stocks are above their 50-DMAs. With the S&P 500 still below the 2,900 “mile-marker” and still greater than 50% of stocks residing below their 50-DMA, the rally that commenced this past week may still have more room to run.
I may not be alone in thinking the market could continue to rally back to, if not above, 2,900 near-term. Bank of America Merrill Lynch’s chief investment strategist Michael Hartnett and a team at the bank said their key contrarian indicator reveals investors are so bearish it might be time to start buying stocks. The BofAML Bull & Bear Indicator plunged to 2.5 in the latest week, ever so close to from buy signal level of 2.0.
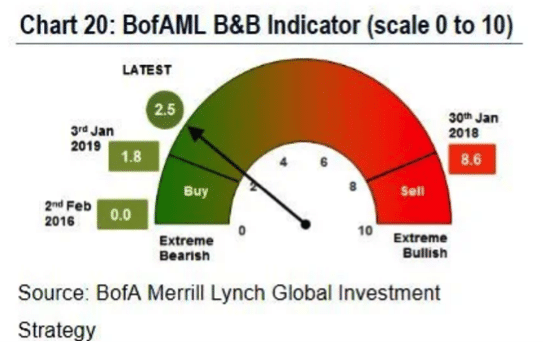
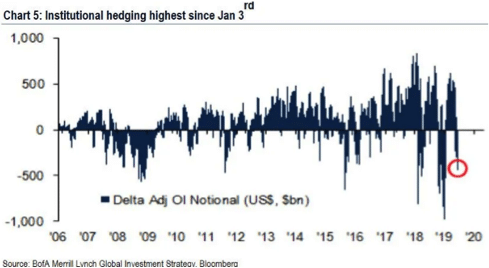
Their proprietary gauge charts whether investor buying or selling of stocks has swung too far either side of a scale of zero to ten. The closer to 0— least bearish—and closer to 10—most bearish. The indicator sticks to this rule: when investor sentiment is over 8, sell equities, and when it’s under 2, buy them. The current level may be flagging a buy signal, and it represents a sizable drop from last week when it was sitting at 3.6, in neutral territory. But don’t worry if you missed the rally this week, you were supposed to and most people did based on BofAML fund flow chart that depicts all the hedging activity in the previous week leading up to June 6, 2019.
Hedging/VIX Positioning
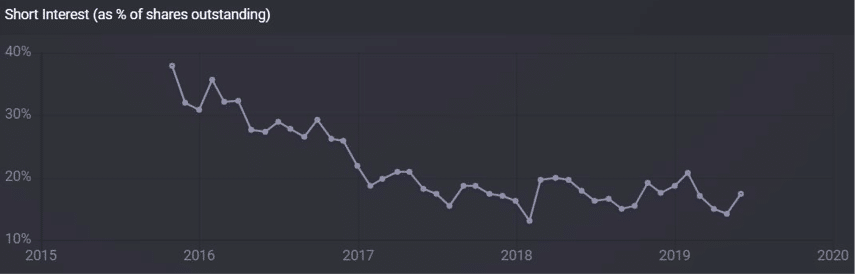
BofAML points out that big institutions are the most hedged right now since the lows of Jan. 3, 2019. Most of the hedging activity has been done via SPY puts and S&P 500 puts. The chart below shows that short interest in SPY has been accelerating through the month of May and into June, as a percentage of shares outstanding.
The usual VIX options and VIX Futures hedging hasn’t been where investors have played the risk-off exercise this go around.
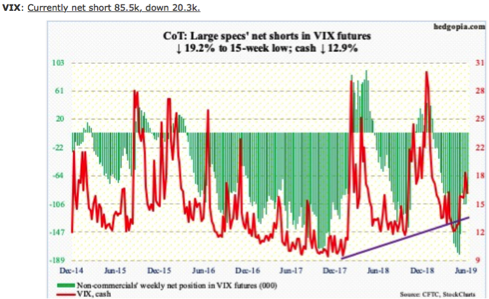
Also according to the latest COT report, non-commercial net short VIX Futures positions continue to decline. Last week, another 20K positions were removed, as depicted in the chart above.
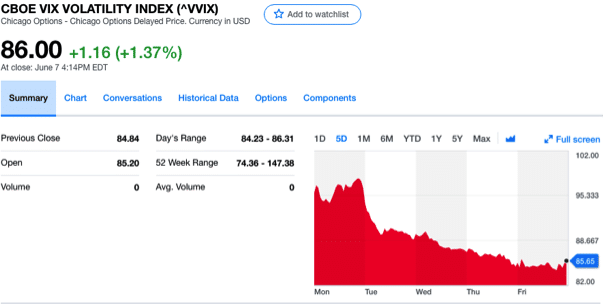
The VIX fell almost 13% last week, with the Volatility of Volatility Index (VVIX) falling roughly 11% from over 93 and to finish the week at 86. It would appear as though VIX options were not the choice of hedges going through this week either.
So here’s the big takeaway from last week and with respect to hedging activity and missing the rally… so what! The risk to the downside from exogenous events like a 5% tariff implemented on all Mexican imports demands caution. Hedging is a disciplined strategy, but so is simply raising cash from winners after a 17% S&P 500 rally in 2019. With some 6 months left in the trading year, there will prove ample enough time to capture more upside from a market that has admittedly been volatile for the last 9 months but also been range bound over that period of time.
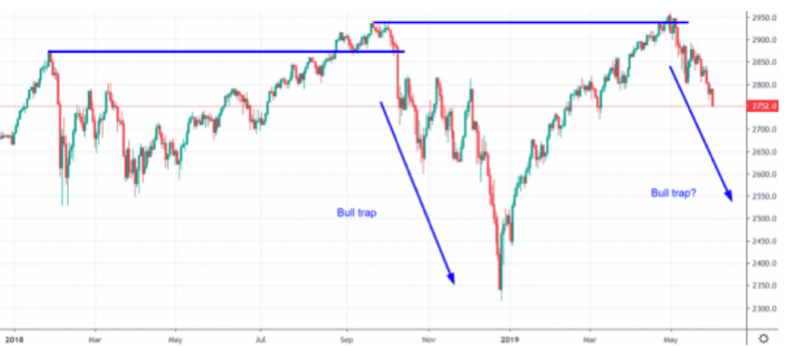
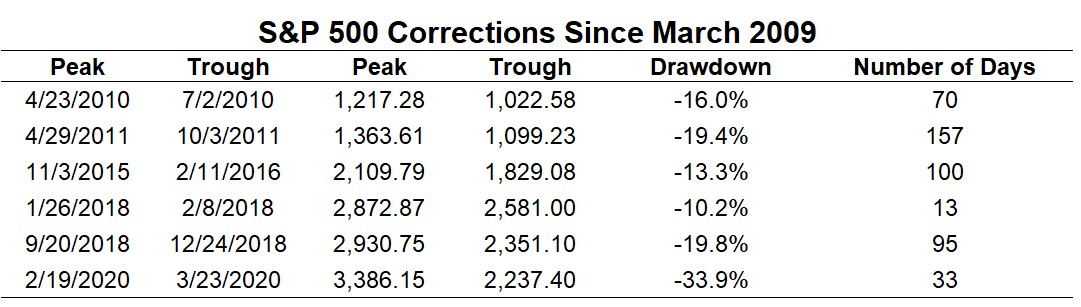
Remember, the S&P 500 first peaked last September and before falling roughly 20% through December 2018. It has since rebounded to produce a minor new high and before falling roughly 7% through May 2019, then rebounding 4%+ this past week. There’s no need to push the gas pedal on risk given the geopolitical uncertainty that continues to pop-up seemingly every few weeks. Simply wait for the appropriate opportunities to present themselves as political uncertainty moves from a heightened state to a state of de-escalation. Check out the St. Louis Fed’s U.S. Economic Policy Uncertainty Index below:
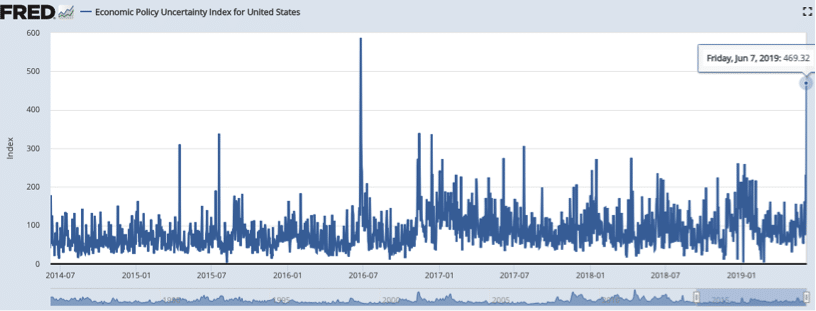
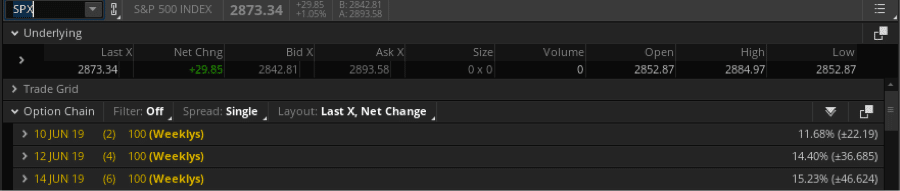
It’s no wonder businesses have a difficult time investing going forward, let alone investors. With all that being said, the weekly expected move for the S&P 500 was breached significantly this past week and in just the first 2 trading days of the trading week. For the coming trading week, the weekly expected move has moderated lower to $46/points and to accompany the VIX’s move lower this past week.
Rate Cuts/Reasons/Market Reactions
To reiterate my S&P 500 theme for corporate earnings and economic growth in 2019, we founded our theme with the acronym EFG: Earnings, FOMC, and Global Growth. To one degree or another, all 3 have been called to the center stage or forefront of investor considerations much more than in past years. This is now the longest economic expansion in U.S. history and depending on whom you ask, the longest bull market in history.
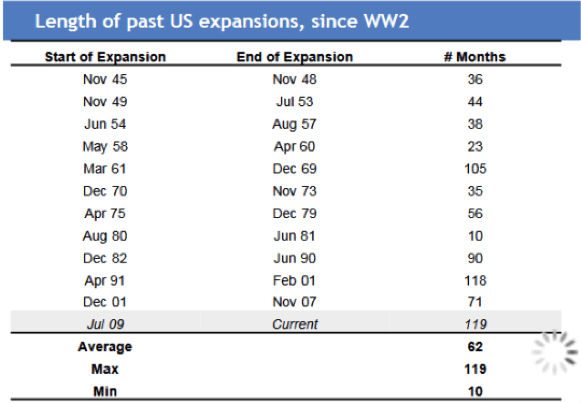
It’s with this in mind and with the backdrop of elevated geopolitical uncertainty that many investors believe the end of the protracted expansion cycle will come sooner rather than later. When we review the economic data, by and large, it does not suggest a recession will be found in 2019, unless an exogenous event occurs.
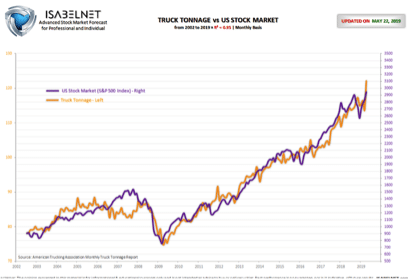
Employment is the most important economic indicator and it has not been this strong in 50 years. New home sales grew 7% last month and reached a cycle high in March. Trucks, which carry 70% of US freight, increased their tonnage by nearly 8% yoy in April (from Isabelnet).
The yield curve is also not indicating an imminent recession. The point of watching out for an inverted yield curve is that future growth is expected to be weaker than today’s; hence lower yields further out in time. In contrast to both 2000 and 2007, today’s curve clearly has a positive slope; future growth is still expected to be stronger than today’s.
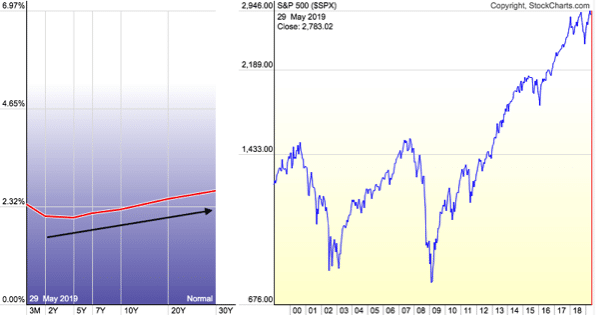
Only the short end has inverted due to the uncertainty over federal funds rates, coupled with long rates that have been heavily influenced by Quantitative Easing programs. The short end of the curve is now found with an increasing probability of rate cuts in 2019.
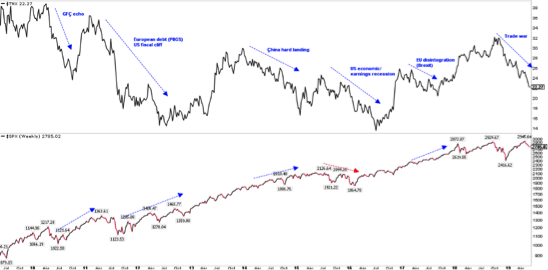
We get it completely! The media plays up the importance of Treasury yields falling and the yield curve inverting. It makes for great viewership to play on the fears of investors. What the media doesn’t do a good job of is rationalizing the fears with back data and statistics. This is not to suggest there aren’t economic concerns that reside within the state of the economy, but there always are and always will be. And of course there is always a reason when rates are falling and in real time, the reasons always feel like the end of the world. In hindsight, when we know the outcome, they seem more benign. The chart below from Urban Carmel shows the causes for rates to fall in the past 10 years (upper panel); after an initial reaction, equities continued to rise (lower panel), with the main exception being late 2015 and early 2016.
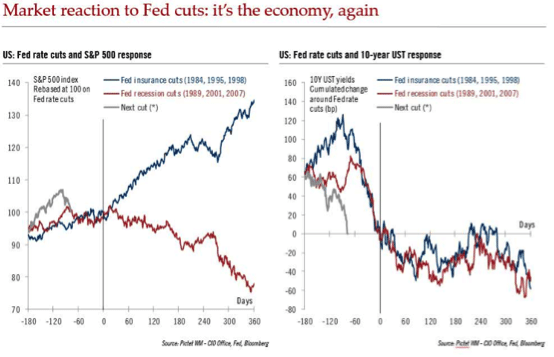
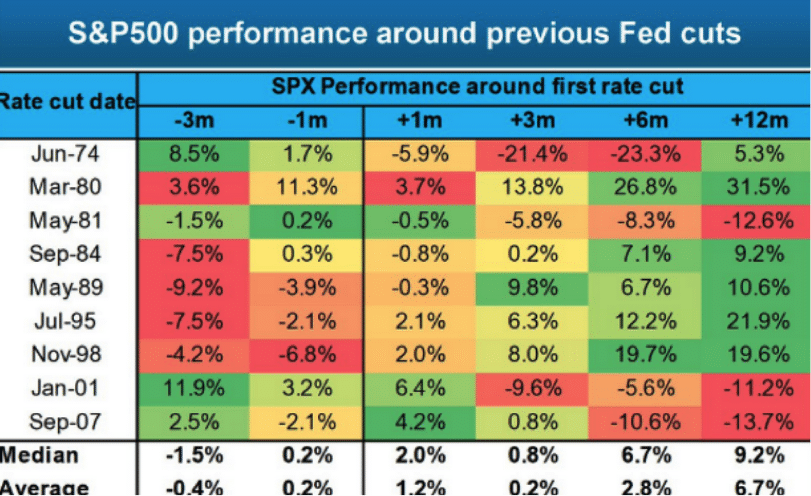
With that being said and recognizing the media doesn’t do a sound job of characterizing or distinguishing between an “insurance cut” and a “recession cut”, the following charts cement the difference for investors. As we can see in the chart below to the left, insurance cuts in 1984, 1995 and 1998 didn’t result in a recession or a bear market. However, recession cuts (Fed behind the curve) were expressed in 1989, 2001 and before the GFC in 2007. There is a difference folks and the set of criterion for a rate cut we are contending with today are not unique; it’s the economy we should always consider with regards to Fed action.
One thing to keep in mind when it comes to what we hear from the media when it comes to Fed cuts or hikes, social media or otherwise, is that we can’t fear both rate hikes derailing the economy and also rate cuts signaling the end of the expansion cycle. While some might say they can both be true if the Fed’s timing is wrong, that’s the variable that is constant and as such adds little relevance. There’s no such thing as the perfect time to cut or hike rates; it all rests in the consideration of the economic data that is ever changing.
The table below also identifies and allows us to more closely scrutinize the market results from past rate cut cycles. What we can see from the table is that the average S&P 500 returns post the first rate cut execution finds the market higher 12 months later by an average of 6.7% and with a median return of 9.2 percent. In dissecting 2001’s rate cut, we are forced to recognize the exogenous event that occurred on 9/11/2001. As such, the rate cut had nothing to do with the forward-looking returns. Additionally, the excess build-up of leverage in the financial markets that existed in 2007 and that led to the GFC doesn’t exist in today’s economy to CAUSE a recession of great magnitude.
While we are forced to recognize that the yield curve has 'inverted' (10-year yields less than 2-year yields) ahead of every recession in the past 40 years, we also recognize it hasn’t done so yet. The lag between inversion and the start of the next recession has been long: at least 7 months and in several instances as long as 2-3 years. On this basis, the current expansion will likely continue through 2019 at a minimum (from JPM).
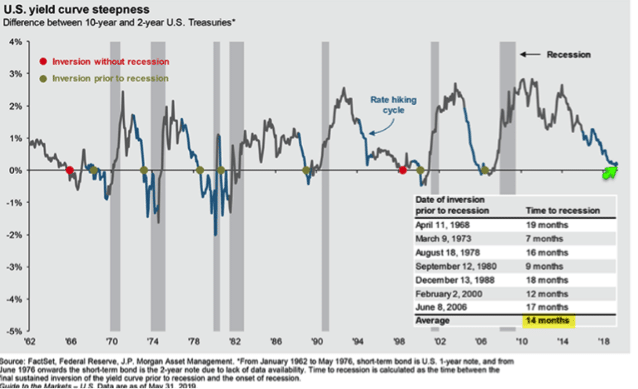
It should also be pointed out that in 1996, the yield curve inverted, then steepened before inverting again in 2000. There have actually been 2 occasions whereby the yield curve inverted and prove to be a false recession signal.
Economic Data
The economic data continues to prove a mixed bag of good, not as good and marginal. On the whole, however, when reviewing the Leading Economic Indicators the data continues to express expansionary conditions. The LEI hit an expansion era high in April.
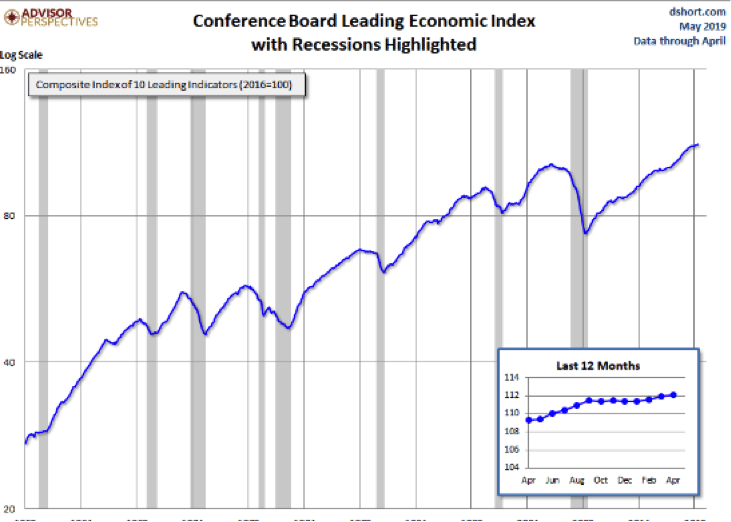
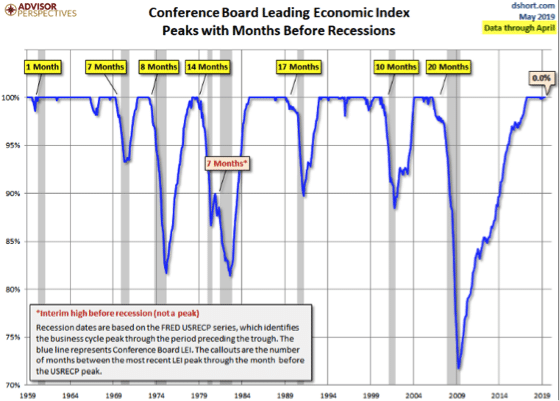
This index includes retail sales, new home sales, equity prices, ISM new orders, manufacturing hours and consumer confidence. This index can fluctuate during an expansion, but the final peak has been at least 7 months before the next recession in the past 50 years. (See chart below)
In the past week, the economic data proved to be largely marginal and definitely underwhelming. The week kicked off with ISM manufacturing activity coming in weaker than expected with a reading of 52.1 against economists’ expectations of 52.6.
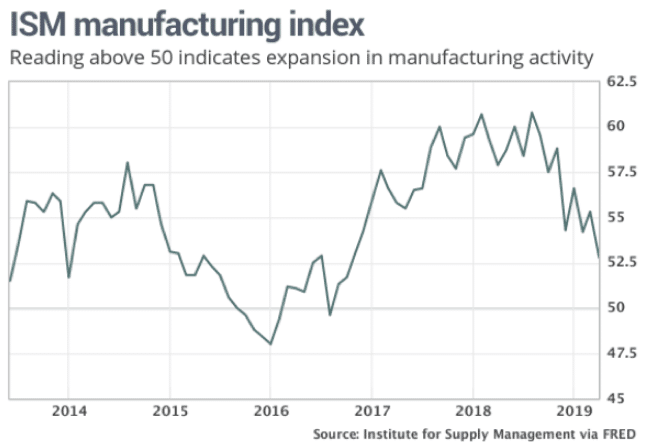
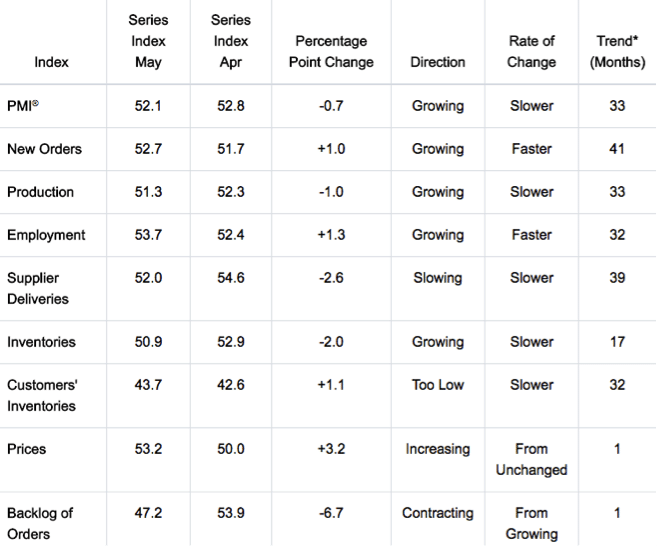
The ISM manufacturing index has been on a steady decline since tariffs were placed on China in July of 2018. The one bastion of hope from with in the index was a tick higher in the all-important New Orders. And if we’re to dig a little deeper into the data, we can also suggest a near-term turn higher in ISM manufacturing may be afoot with Customer Inventories remaining at “too low” levels. (See table below)
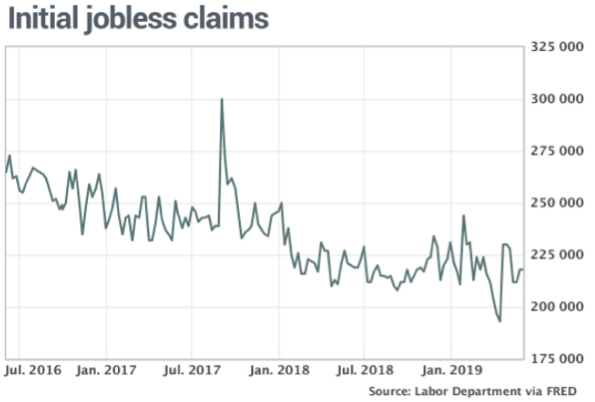
The disappointing ISM manufacturing index reading was followed by disappointing ADP private sector payroll (an increase of 27K jobs in May) and better than expected ISM non-manufacturing data (service sector growth). On Thursday we learned that Initial Jobless claims remained near the lows of the late 1960s, registering 218,000 claims.
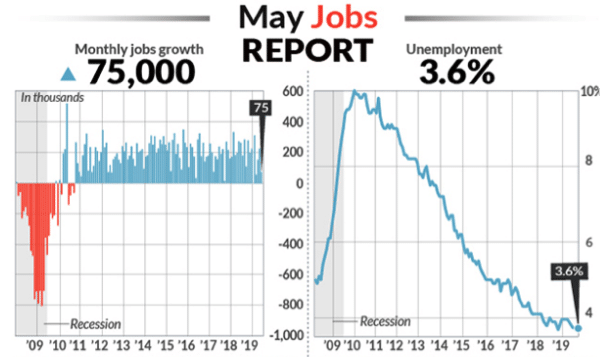
What likely increased the probability for a Fed rate cut that was already at elevated expectation levels was the latest Nonfarm Payroll data, which missed estimates greatly. Economists were anticipating that the economy grew jobs by roughly 180,000 in the month of Month. The results were far less at 75,000 new jobs and with the increase in wages over the past 12 months slowing to 3.1% from 3.2 percent. Wage growth peaked at 3.4% earlier this year.
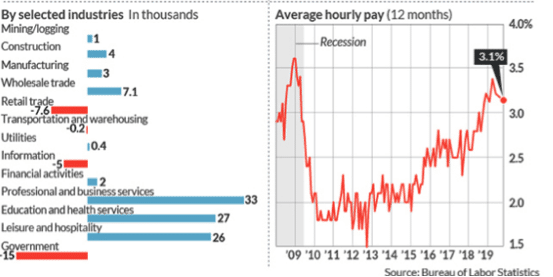
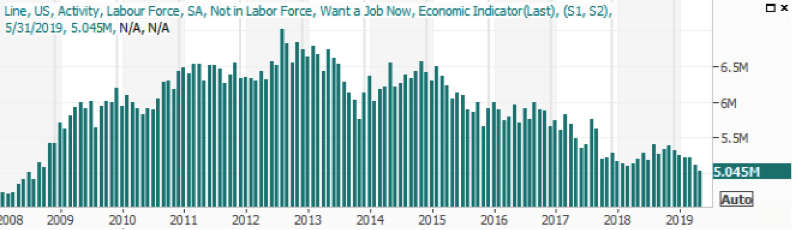
Despite the woeful headline numbers, the equity market responded favorably as the belief that the Fed would have ample economic data to support a future rate cut. Reverting more specifically to the Nonfarm Payroll data, it wasn’t all bad. Where the real progress was made was in the number of people who aren't being counted as unemployed, but would still like to have a job. That figure fell from 5.121 million to 5.045 million a 76,000 decrease. (See chart below)
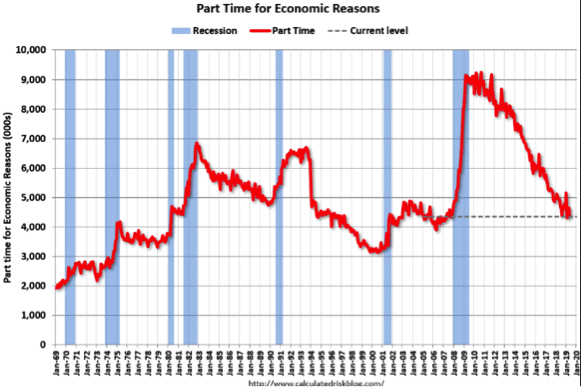
The number of persons working part time for economic reasons decreased in May to 4.355 million from 4.654 million in April. The number of persons working part time for economic reason has been generally trending down.
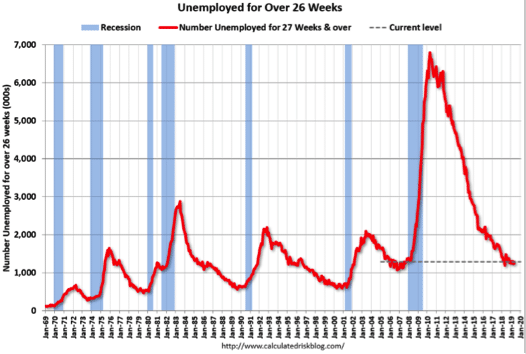
Moreover, according to the BLS, there are 1.230 million workers who have been unemployed for more than 26 weeks and still want a job. This was down from 1.305 million in March and near a cyclical low… again!
There are many issues that plagued the recent Nonfarm Payroll data from flooding in the Midwest that has reached crisis levels to the number of skilled workers available to fill positions. By and large, when we look under the hood of the NFP data, we should expect slowing job growth this late in the economic cycle. Having said that, we think the latest reading will prove an anomaly for the calendar year and be found with more robust jobs growth in the summer months.
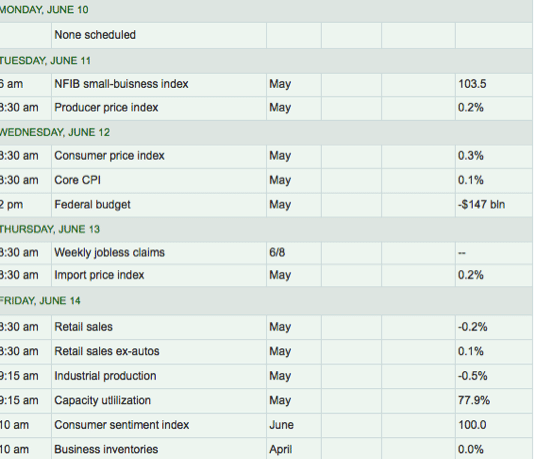
For the coming week, the Fed remains in play now that the labor & employment component of its dual-mandate is proving worthy of pushing the Fed closer to a rate cut. Next week the inflation component of the Fed’s dual-mandate will be tested as both PPI and CPI data will be delivered. To round out the week, investors will hope to see an improvement in monthly retail sales after a disappointing -.2 decline in retail sales for the month of April. Investors should keep in mind that YoY retail sales grew by more than 3% in April. Additionally, the declining price of gasoline in late May will serve as a headwind for the headline MoM retail sales number when it is released.
As I noted early on in this weekly Research Report, this expansion cycle has not strapped itself with excess and leverage the likes of what we’ve seen in previous expansion cycles. While debt levels are ever increasing, they are found more easily serviced with household debt to income levels at their best level since the 1990s. Corporate balance sheets remain flush with cash and rates remain at historically low levels.
Fund Flows Will Likely Stink Going Forward
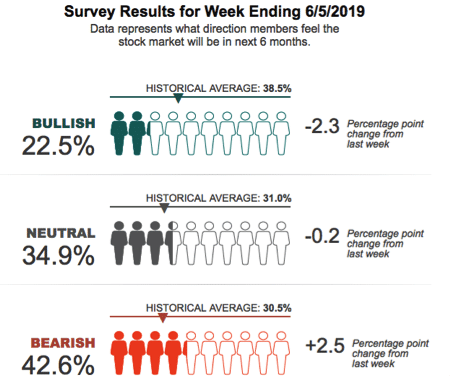
As shown in the latest AAII survey, investor sentiment continues to show bullish sentiment waning and below the historic average.
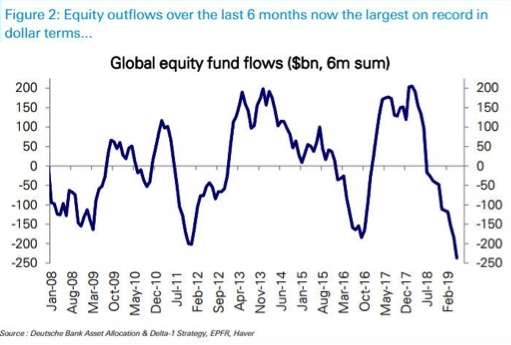
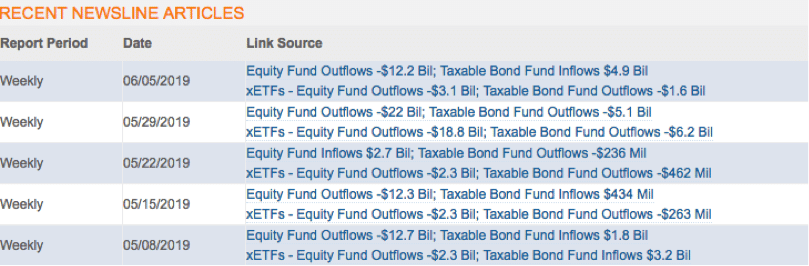
Given that bearish sentiment has dominated since May, it’s no wonder fund flows continue to seek safety in bonds and flee equities. Coming into June, equity outflows over the last 6 months in dollar terms have now been larger than over any prior 6-month period.
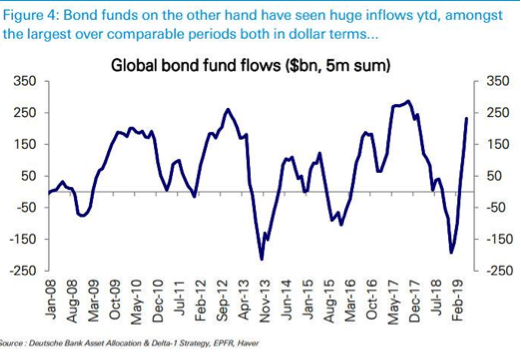
By contrast, bond funds have seen inflows of $220bn year-to-date.
There was no trend change in fund flows according to weekly FundFlow data from Lippper this past week ended Thursday. Another large outflow (-$12.2b) from equity MF + ETFs this week; that’s 4 large outflows in the past 5 weeks. So far this year, a net outflow of -$74.4bn.
It has remained baffling to many investors and analysts when analyzing the fund flow data week-to-week as to the buoyancy of the markets.
Earnings Season is Over
While geopolitical tensions, tariffs and slowing global growth grab headlines, since earnings season has largely ended for the Q1 2019 period, investors may have forgotten about what Q2 2019 earnings may bring. While earnings recession for the Q1 period was avoided, the Q2 period has come into question given the global growth slowdown that will likely negatively impact U.S. companies that capture more than 50% of their revenues from overseas.
FactSet has recently forecasted S&P 500 EPS to decline by 2.3% in the Q2 2019 period, largely due to the mix of revenues derived overseas and the stronger U.S. Dollar YoY. For companies that generate more than 50% of sales inside the U.S., the estimated earnings growth rate is 1.4 percent. For companies that generate less than 50% of sales inside the U.S., the estimated earnings decline is -9.3 percent.
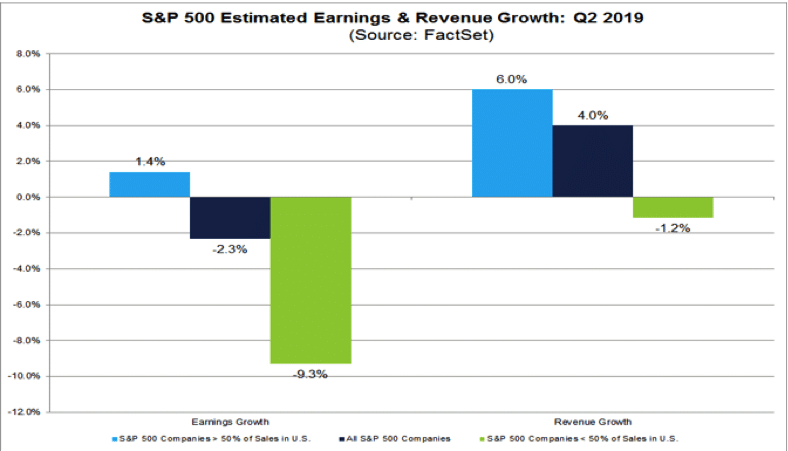
The estimated revenue growth rate for the S&P 500 for Q2 2019 is 4.0%. For companies that generate more than 50% of sales inside the U.S., the estimated revenue growth rate is 6.0%. For companies that generate less than 50% of sales inside the U.S., the estimated revenue decline is -1.2 percent.
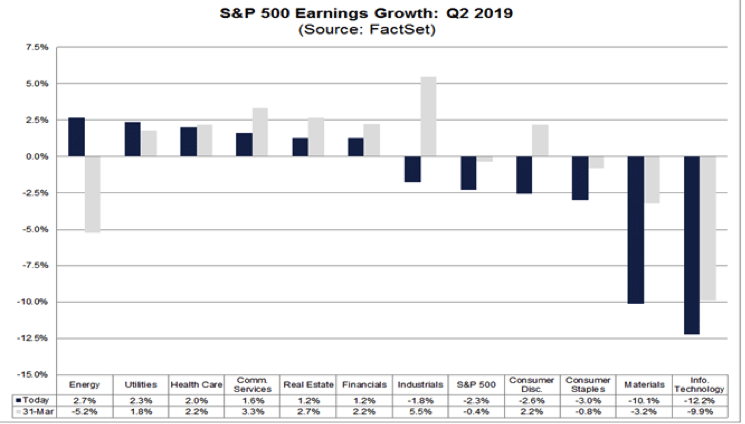
At the sector level, the Information Technology is expected to be the largest contributor to the earnings decline for S&P 500 companies with more global exposure in Q2. Overall, this sector is predicted to report the highest earnings decline of all eleven sectors in Q2. This sector also has the highest international revenue exposure of all eleven sectors in the index.
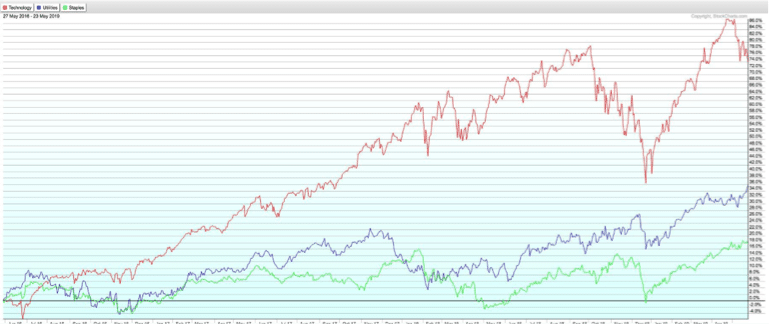
Given the aforementioned risk posed to the Information Technology sector, it’s no wonder that the IT sector has underperformed safer haven sectors such as Utilities and Consumer Staples, over the last 3 weeks.
As we have had more than 99% of S&P 500 companies reported their quarterly results, the forecast for Q2 EPS leaves much to be desired and still with headwinds. The global economy has not strengthened and where we’ve seen weakness in Europe and China; that weakness shown through manufacturing data has found its way to the United States.
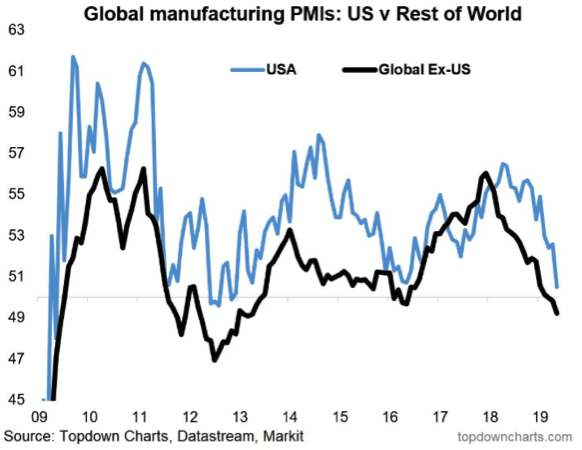
Global economic activity weakening, the U.S. Dollar strength and Crude oil weakening in May might prove to further impact corporate earnings and revenues in the Q2 period. It remains to be seen if, with the support of an even more accommodative Fed, that multiple expansion can offset earnings weakness should it come to pass.
Investor Takeaways
I’m sure the first question on most investors list of questions, given the probability of a rate cut, is, “What if the Fed doesn’t cut?” I’ve definitely considered that question in our research activity over the course of the week. Recent notes from Goldman Sachs’ chief U.S. equity strategist David Kosten notes that since 1988, on 13 occasions the futures market expected a cut in the funds rate the day prior to a scheduled FOMC meeting. The Fed cut rates in all 13 instances. In other words, the Fed has always cut interest rates when the market priced a cut on the day prior to a FOMC meeting.
Since we already know the from history that the market tends to perform positively over the next 12 month period and after the first rate cut, what sectors have performed well should be the next question posed by investors. Here is what Goldman Sachs found:
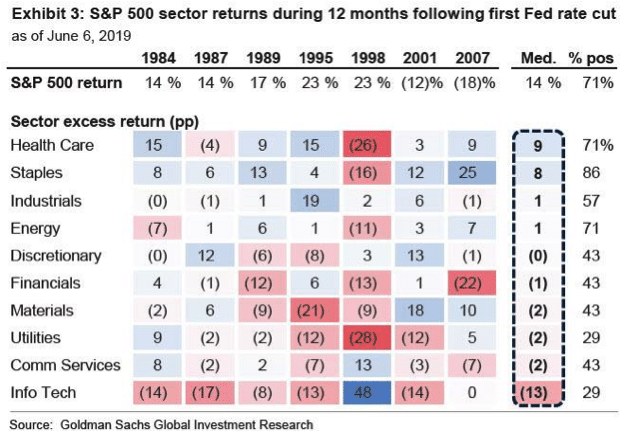
“Among sectors, the defensive Health Care and Consumer Staples sectors performed best following the start of cutting cycles while Information Technology posted the worst returns (Exhibit 3). Health Care has outpaced S&P 500 by a median of 9 pp during the 12 months following the start of a Fed cutting cycle. Consumer Staples outperformed by a similar magnitude. The idiosyncratic Communication Services sector has generated the best relative returns and hit rate of outperformance during the subsequent 3 months (+4 pp, 100%), but has underperformed over a 12-month horizon. Info Tech ranks as the worst performing sector during the subsequent 12 months (-13 pp) [ZH: this is bad for a sector that has been the source of profit margin growth in the past decade].”
Comments
Log in or sign up to join the conversation.