
Summary
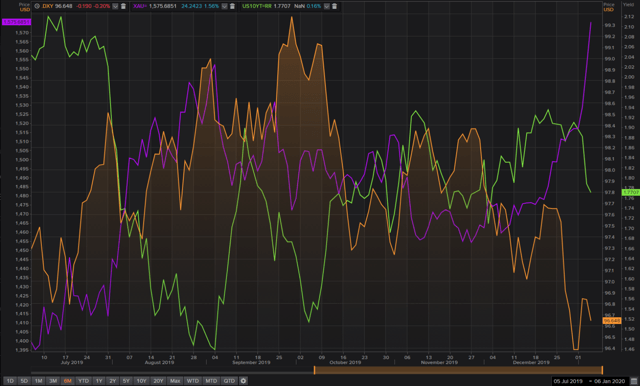
- Pardon us for being blasé, but we don't see WAR spelled in any of these risk assets e.g., equities, yields. We don't see it either, in the energy sector, gold.
- True, Gold was sharply higher, but it's been heading that way (due to falling yields) even before Trump took out Suleimani. We've said earlier Gold is in long structural bull-phase.
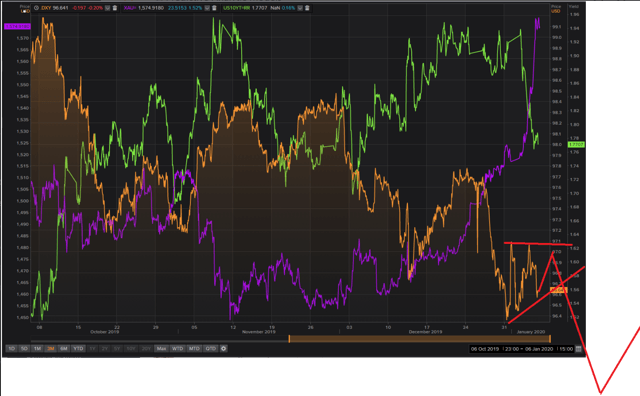
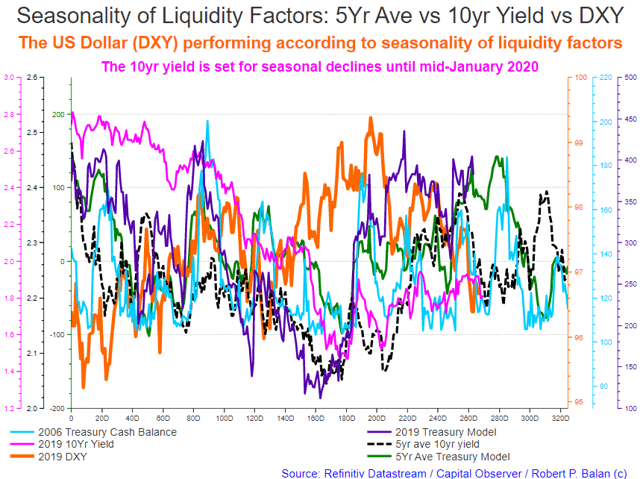
- The DXY is just about to resume a short fall after a triangle-like consolidation pattern is completed, likely evidence that markets believe no shooting war will take place.
- Two things for this muted reaction from risk assets: (1) The markets believe that the global central banks will come to the rescue and any risk asset decline will be an opportunity to pick up cheapened assets, and/or (2) The market believes that despite hot words, Iran is not really willing to go to war with the US -- at least not at this time, and not in the form that many believe it would take: a clash of arms.
- That means, we don't have to rely on catastrophic turn of geopolitical events to provide risk assets the motive force. There are other, broader-based factors that are at play -- even before the US killed Suleimani. The systemic liquidity situation for one, which is undergoing a mini-seasonal drought, helped initiate the downturn process in risk assets as early as December 23 in the 10yr yield, and on January 1 in the SPX.
No signature of WAR in these asset price moves
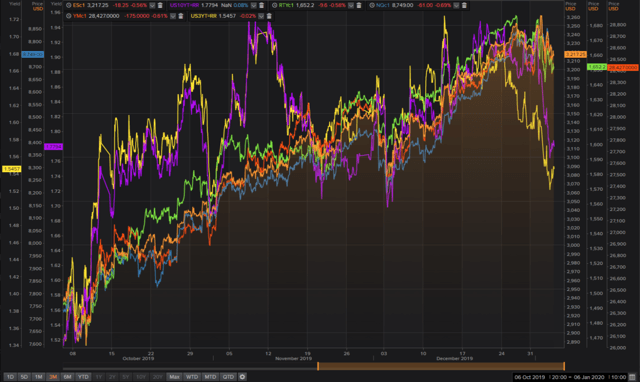
Pardon us for being blasé, but we do not see any WAR spelled in any of these risk assets e.g., equities and yields (see chart below).
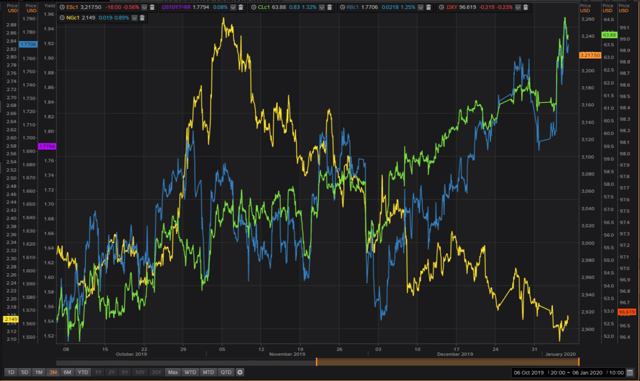
We don't see WAR here, either, in the energy sector (chart below).
Two things may explain this muted reaction from risk assets:
(1) The markets believe that the global central banks will come to the rescue and any risk asset decline will be an opportunity to pick up cheapened assets, and/or
(2) The market believes that despite hot words, Iran is not really willing to go to war with the US -- at least not at this time, and not in the form that many believe it would take: a clash of arms.
Just as Ayatollah Khamenei tweeted to US President Trump right before he then killed Iranian Revolutionary Guards Council head Qassem Suleimani--“You can’t do anything ” -- at this point, Iran can't or more likely, won't, do anything to bring on a massive US retaliation on their military and "cultural" assets. Not right away, that is.
That means, we don't have to rely on a catastrophic turn of events to provide risk assets the negative motive force. There are other, broader-based factors that are at play -- even before the US killed Suleimani. The systemic liquidity situation is one, which is undergoing a mini-seasonal drought, and has helped initiate the downturn process in risk assets as early as December 23 in the 10yr yield, and on January 1 in the SPX.
Liquidity inflows have been falling
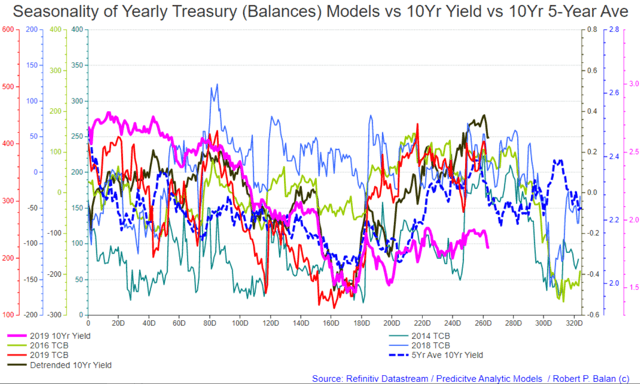
We saw the 10yr yield keel over as shown in this original chart published in the PAM Market Report of December 23. The 10yr yield at that time was right at the precipice of a brief mini-liquidity cliff which last about two weeks. Yields went downhill all the way from there up to now.
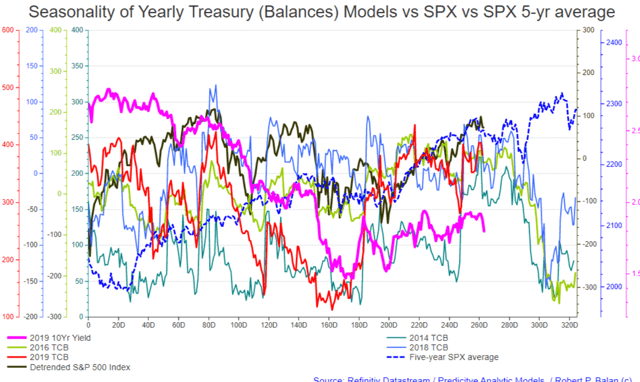
But the S&P 500 Composite Index (SPX) at that time has not topped out yet, and that was clear from the chart below. SPX needed a few more up days before it hits the start of the mini-seasonal liquidity drought (see chart below). True enough, SPX peaked on January 1 and have been lower since then.
Clearly, the assassination of Sulameini significantly helped drive the risk assets lower, but the killing was not the only motive force responsible for the risk asset price declines. Liquidity outflows were, and still are, cutting the markets at the knees.
Gold is biggest beneficiary of the US-Iran clash
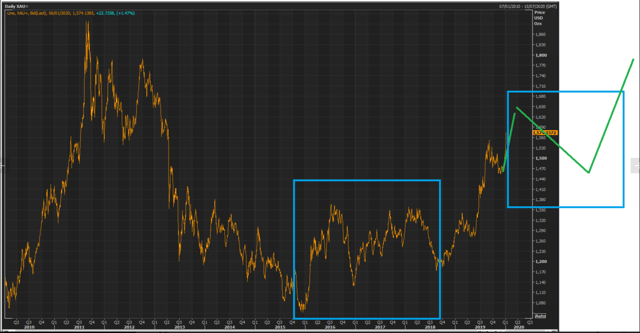
It was also true that Gold was sharply higher, but it has been heading that way (all due to falling yields and weakening US Dollar) even before President Donald Trump ordered Suleimani taken out (see chart below). Gold is set to benefit the most from the Iran-US contretemps.
As we said earlier, Gold was due to make a higher high, primarily due to structural reasons (discussed in detail in the Dec 26 PAM Market Report), and the fact that we expect yields to (possibly) make a play on the 1.50% area again.
Gold is also in a long, structural bull-phase, and should be propelled by weakening US growth and declining risk asset prices during H2 2020, as we illustrated with the chart shown below.
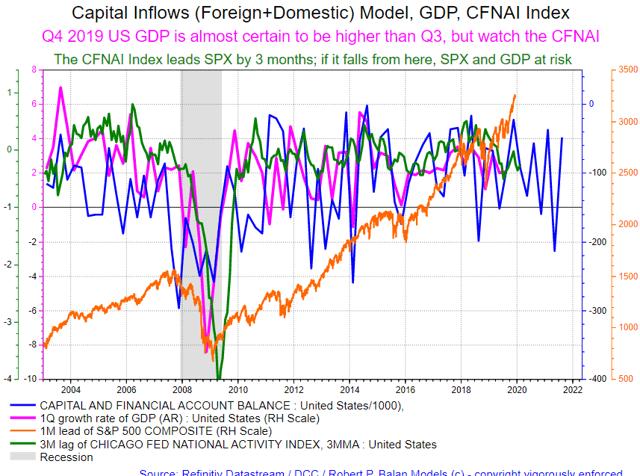
Capital inflows (foreign and domestic -- the ultimate systemic liquidity source for US financial markets) have a long-acting, and pervasive impact on US GDP growth and financial risk assets (like equities, bonds, gold, US Dollar); see chart above. But we needed another higher-frequency variable to confirm and provide more detailed inflection points, and we found the CFNAI highly suitable for this purpose.
Long story made short, if the CFNAI continues to fall from current levels, then our thesis of weaker H2 2020 GDP growth and risk asset prices is very likely correct. And Gold prices will soar under those conditions.
The US Dollar has a large role to play in the unfolding gold story. The DXY is in the process of completing the wave 4 of a larger Wave 3 sequence, and should be followed by more declines. It looks like the DXY is just about to resume the downtrend after a triangle-like consolidation pattern is completed in a day or two, see chart below.
The expected declines for DXY are for the near-term. We show a chart which we published a few days ago in the PAM Market Reports At The Chat, showing a near-term DXY decline. And this is a scenario that make sense in the absence of a shooting war between the US and Iran.
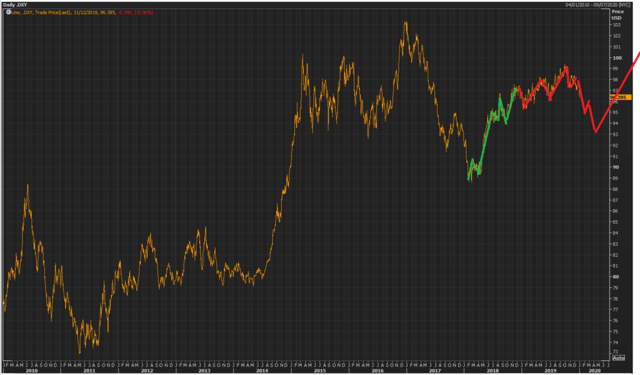
The power of liquidity flows (plus a little understanding of the evolution of market structure), also helps analyse asset price trajectory without being carried away by sentiment. And it may be the case that at some point in the next week or so, DXY may still fall, and then later on in February rise again following the broad strokes of the Treasury Cash Balance (light blue line, see chart below).
That near-term DXY decline would be complementary the completion of wave 5 of a larger Wave 3 sequence in the Gold (XAU) long term EWP structure, which we have roughly outlined in the chart below.
We explained this in greater detail in the PAM Market report of December 26.
So the hit on Suleimani helps the already ongoing Gold rally, and may in fact help it overshoot normal EWP targets. But to assume that Gold will perform extraordinarily merely on this brouhaha might be a significant mistake. Nervous sentiment will help, but the gold rally will have to build on structural/growth and liquidity factors, further out, the move itself a part of a grander time series which should end testing the previous high at circa $1,900 in 2011 (see chart above).
Conclusion
We are putting out these stuff because at some point the current risk-off moves in risk assets and yields will have to come to an end -- and we have to do something without the fear/hope of a potential war coloring our decision-making process.
And we believe that is not being imprudent -- we just can't see how the Iranians (if they are rational) will want to bring on the might of the US military on their heads. Oh, they will exact revenge -- but now that the US has displayed capability to take out their leadership, they have to be very careful not to get out of bounds.
Well, if they are being non-rational, that is a different story altogether. But we also firmly believe that the Ayatollahs believe in self-preservation -- that is a very powerful incentive to keep the narrative and action symmetrical, even if hot on the whole.
Therefore, instead of just focusing on geopolitics, maybe we should also keep an eye on what is happening in the systemic liquidity front.
Outlook and game plan:
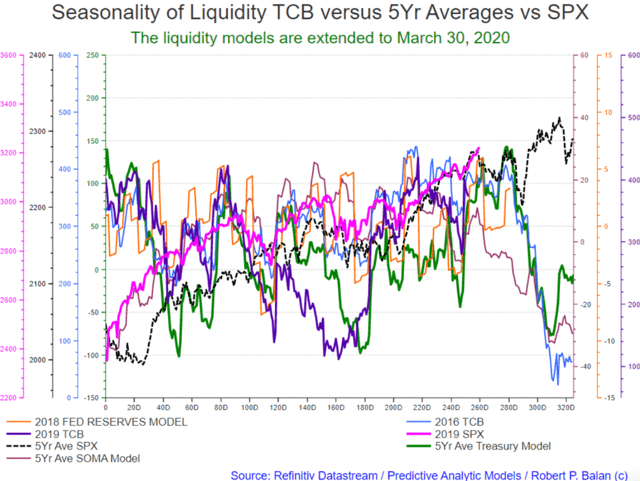
Here is a compact and simple illustration of the current liquidity situation, just using the seasonality of the Treasury Cash Balance (TCB). We can add more bells and whistles, but that won't change the story. You will see the limited potential for an SPX downside pullback, which could be a week or longer, depending on how the Inv and Hedge Funds continue to front run the TCB. Then it is time to get long equities ahead of a bigger inflection point of a top on equities sometime in mid-March,
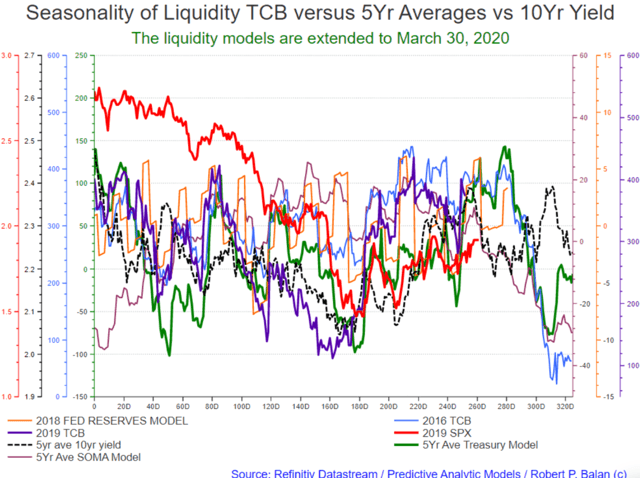
And here is the same analytical platform used on the 10yr yield and its five-year average. Same timing -- a week or perhaps a little longer on the downside for yields. Again, assuming the Investmemt Banks and Hedge Funds do not change their frontrunning strategy on the Treasury Cash Balance. Then it is also time to be short bonds, with yields predisposed to rise until mid-March.
Ahead of the January 15 signing of the China -US trade deal, we do not really expect much potential from equities on the downside. The gullible are still waiting for an equity uptick upon signing of trade documents (as if it will make further difference). We just wonder what market pump mechanism Trump and Kudlow conjure up next to lead the equity markets to the end of the rainbow? We wonder if the gullible starts the countdown to the Phase 2 agreement.
It looks like we have plenty of trading gymnastics to perform, given the mini-seasonality galore in the liquidity models. But swing we will with the models. And let's just hope the Investment Banks and Hedge Funds do not screw us up again by changing the number of trading days they front run the inflection points of the Treasury Cash Balance.
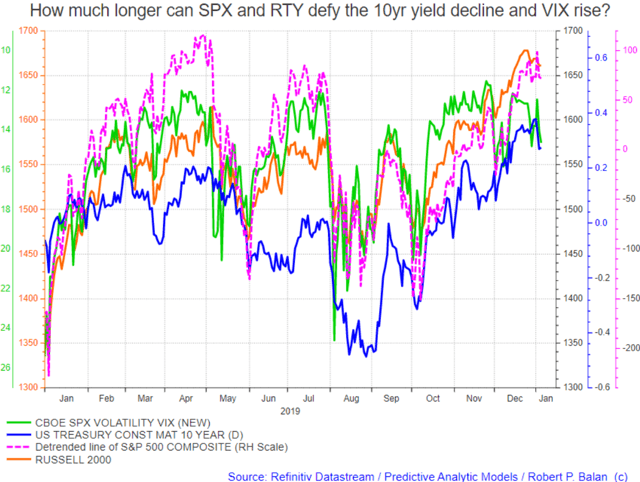
One more conundrum to solve: How much longer can SPX and RTY defy the 10yr yield decline and VIX rise? The next few days trading should provide the answer.

Comments
Log in or sign up to join the conversation.