
From time to time we track the put-call ratios for GDX, GLD and SLV. The put-ratios for GLD and SLV gave good timing signals in 2015. GDX’s signals are a bit more tricky and we have not paid much attention to them.
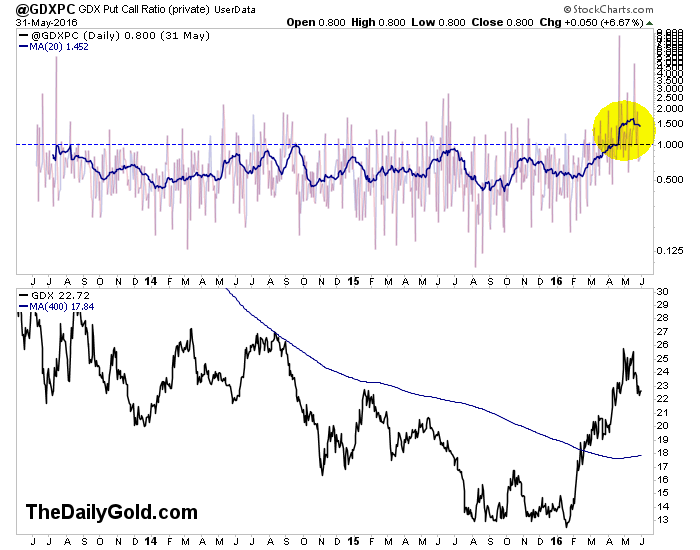
The chart below plots GDX’s put-call ratio, smoothed by a 20-day moving average (blue). As gold stocks emerged from the January bottom options traders met the rebound with skepticism and all the way into May. Note the 20-dma was contained at 1.00 for several years until recent months. From the standpoint of a bull, it is good (in the big picture) to see this skepticism.


Comments
Log in or sign up to join the conversation.