
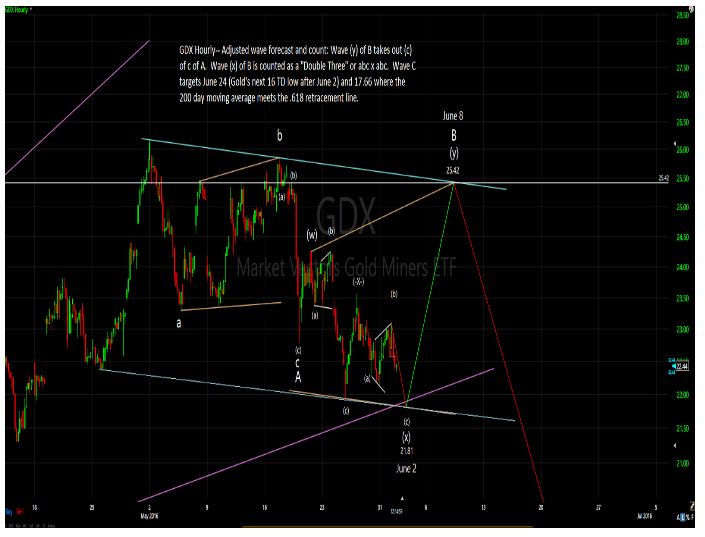
GDX and gold look to make their low around June 24, not June 17th as I had reported earlier. The cycles are following gold’s and not GDX’s cycle. June 2nd is a cycle change point (either a low or high) and happens to be the 16 TD low for gold.
The chart below shows GDX’s wave count ending an (x) of B wave on June 2 near 21.81 and rallying to 25.42 by June 8th to finish (y) of B. The terminus of Wave C should occur on June 24 near 17.66 for GDX.
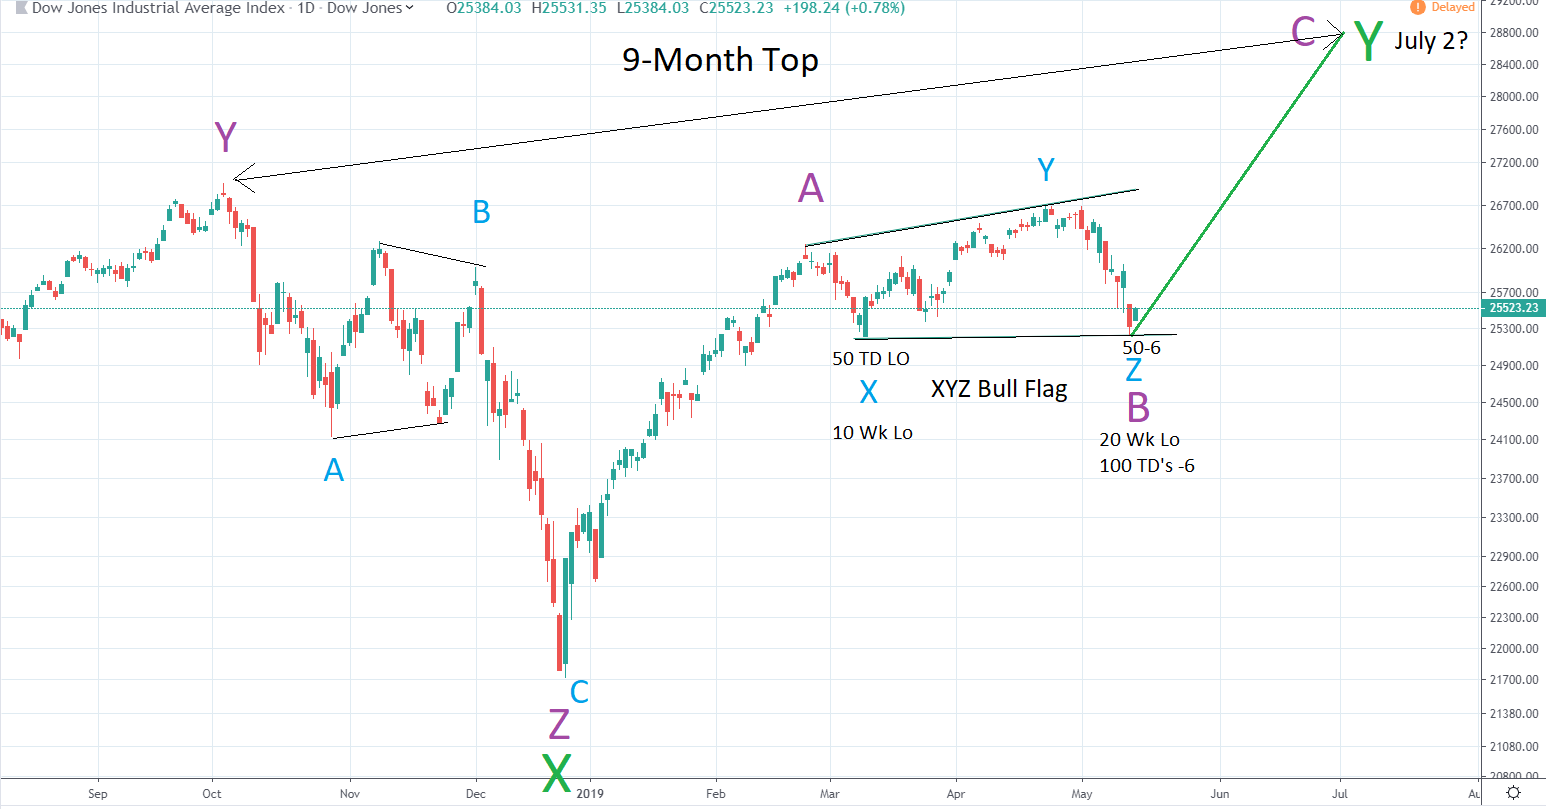
IF GDX, gold and the stock market follow last year’s 9-month pattern (running 10 months) the stock market may not see its next important low until Monday, July 25, somewhat similar to the August 24, 2015 crash.

Comments
Log in or sign up to join the conversation.