

GDP growth in Q3 was revised up 0.1% (SAAR). Real GDI was released; taking average of GDP and GDI reveals the possibility that actual growth was faster than indicated by GDP alone. And while forecasted levels have been downwardly revised over the past months, the most recent nowcasts suggest acceleration.
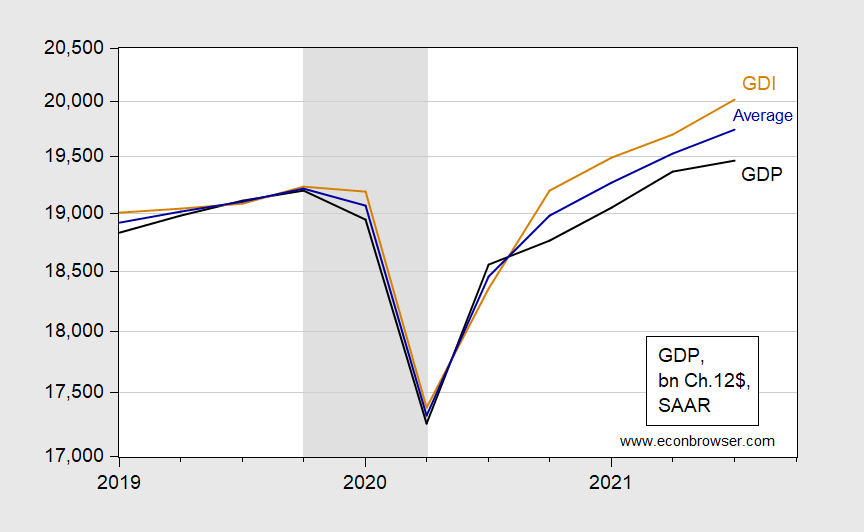
Figure 1: GDP (black), and GDI (tan), and arithmetic average (blue), all in bn. Ch2012$, SAAR. NBER defined recession dates, peak to trough, shaded gray. Source: BEA, 2021Q3 2nd release, NBER.
The growth rate of gross domestic output (the average of GDP and GDI) is 4.4% (SAAR), compared to the reported 2.1% for GDP. On a year-on-year basis, the figures were 7.0% vs. 4.9%, respectively.
What’s the outlook for GDP as measured? Figure 2 presents median forecasts from the Survey of Professional Forecasters over the past three surveys, and nowcasts as of today.
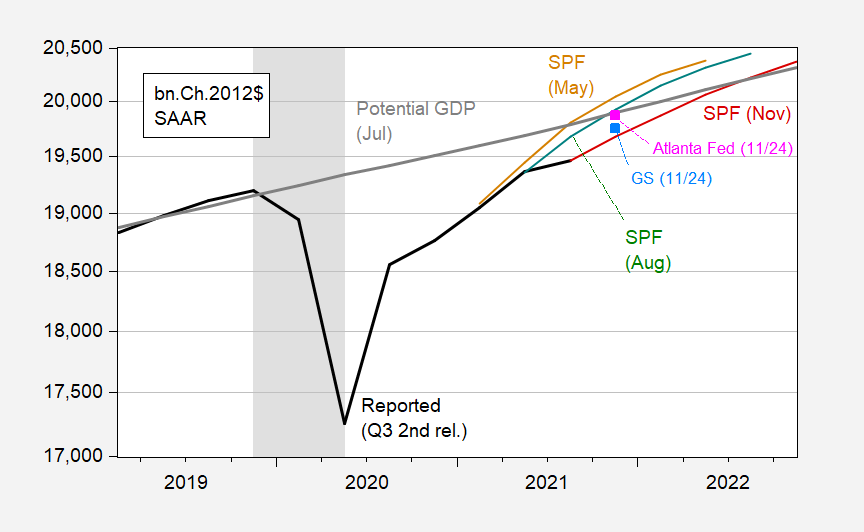
Figure 2: GDP (black), Survey of Professional Forecasters May median forecast (tan), August (green), and November (red), Atlanta Fed nowcast (pink square), Goldman Sachs tracking (light blue square). NBER defined recession dates, peak to trough, shaded gray. Source: BEA, 2021Q3 2nd release, Atlanta Fed (11/24), Goldman Sachs (11/24), NBER, and author’s calculations.
Forecasts of levels have been reduced over the last three surveys, noticeably since the August survey. That level downshift is largely driven by the low growth in 2021Q3. Interestingly, nowcasts for Q4 indicate an more substantial rebound than envisioned in the November SPF survey (responses between October 28th and November 9th). The Atlanta Fed’s nowcast indicates an 8.6% q/q SAAR growth rate in Q4.
In the near term (end-2021), the Atlanta Fed nowcast puts us where the August SPF median indicated (in terms of implied level).
In sum, it looks like in Q3, growth (and employment growth) was slowing (as some of us warned). However, growth seemingly has picked up at year’s end.


Comments
Log in or sign up to join the conversation.