
Market participants, analysts, strategists and even some economists could be rightly criticized for cherry-picking economic data to support their views. If one disagrees (by considering all the data), one is either a hater (if one is too bearish) or in denial (if one is not bearish enough). However, there is (in my opinion) a reliable indicator of economic conditions; U.S. GDP data.
Risk asset markets were positively jubilant after yesterday’s economic data. The data over which market participants gushed included ISM Manufacturing that printed in negative territory (albeit less so) for the fifth-consecutive month, ISM Prices Paid which were unchanged at a disinflationary 38.5 and ISM New Orders, which printed at an unchanged 51.5, which indicates mediocre growth.
I am not saying that markets should not have been cheered. As physics teaches, deceleration is, in fact, acceleration in the opposite direction. Thus, ISM Manufacturing which declined at a slower pace and ISM Prices Paid which fell less dramatically than anticipated should be viewed in a positive light. However, the data offered little indication that the U.S. economy was poised to attain so-called escape velocity (3.0% or greater annual GDP). In fact, there was a report released yesterday which did offer a glimpse into the growth rate of the U.S. economy.
Following yesterday’s data release, the Atlanta Fed updated its GDPNow forecast. The latest reading of the GDPNow forecast was updated lower to 1.9% from a prior 2.1%.
GDPNow Q1 U.S. GDP forecast (Source: Federal Reserve Bank of Atlanta):
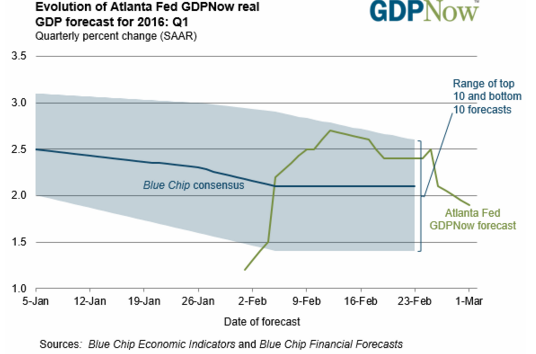
As you can see, the GDPNow forecast for Q1 GDP peaked in mid-February and has trended lower since, particularly as February economic data became available late last month. Even the “Blue Chip Financial Forecast” (private-sector economists) is forecasting Q1 GDP of about 2.1%. Even the most aggressive estimate within the Blue Chip survey is 2.6%.
It does not take a rocket scientist, or even a PhD in economics to figure out the economy. Job growth of about 200,000 per month is (now) consistent with 2.0% GDP growth and 2.0% to 2.5% wage growth, as are Initial Jobless Claims of about 270,000. Yes, this is different than the past, but today’s economy is very different than it was ten or twenty years ago. It is definitely different than the economy of the 1960s, when many of the economic models in use today were developed.
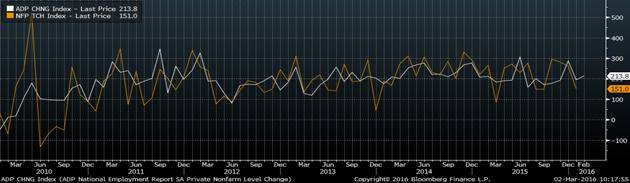
When the ADP Employment Change report showed 214,000 new private sector jobs, the financial punditry were cheering loudly. Immediately, assumptions were made that this augurs for a faster pace of U.S. economic growth. However, recent historical data does not bear this out:
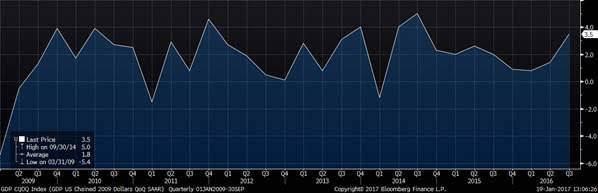
U.S. Annual GDP since 2010 (Source: Bloomberg and BEA):
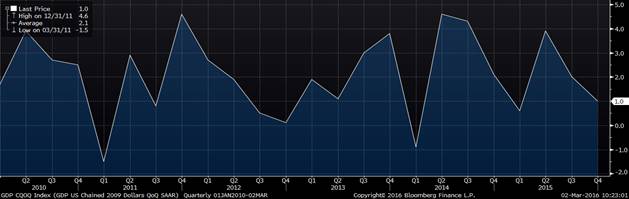
Since 2010 (the first full year of the current U.S. economic expansion), monthly ADP-measured job growth has averaged 187,000 per month. Over that same time, Non-Farm Payrolls has averaged 188,000 per month. Since 2010, U.S. GDP has averaged 1.8%. I see little which has changed. I see little evidence that the U.S. economy is poised to surge to 3.0% GDP, anytime soon. Job growth could continue to average between 180,000 and 200,000, if U.S. labor remains cost-effective versus alternative sources.

Comments
Log in or sign up to join the conversation.