

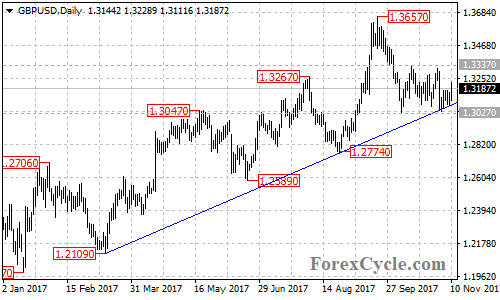
GBP/USD moved sideways in a narrow range between 1.3027 and 1.3337. The price action in the range is likely consolidation of the downtrend from 1.3657 and a further decline is still possible after the consolidation.
There is a bullish support trend line on the daily chart. A clear break below the trend line will confirm that the upside movement from 1.1946 (Oct 2016 low) had completed at 1.3657 already, then a deeper decline to test 1.2774 support could be seen.
A breakdown below here could trigger further downside movement into the 1.2100 zone. Near term resistance is at 1.3337. Only a breakout from this level could bring the price back towards the falling trend line on the weekly chart, now at around 1.3470.


Comments
Log in or sign up to join the conversation.