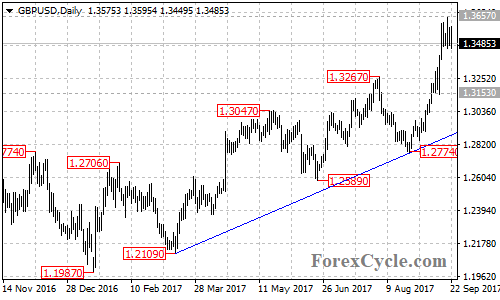
Near term support is at 1.3360, followed by 1.3153, below these levels could bring price back towards the rising trend line on the daily chart. Only a clear break below this trend line support could signal completion of the uptrend.
GBP/USD is now facing a long term bearish trend line on its weekly chart. An upside break through the trend line could take price to next resistance level at 1.3950 which would be the final target of the uptrend from 1.1946 (Oct 2016 low). Near term support is at 1.3360, followed by 1.3153, below these levels could bring price back towards the rising trend line on the daily chart. Only a clear break below this trend line support could signal completion of the uptrend.
Disclaimer:
Futures, options, stocks, ETFs and over the counter foreign exchange products may involve substantial risk and may not be suitable for all investors. Leverage can work against you as well as for you. You should therefore carefully consider your investment experience as well as financial condition before deciding if trading is suitable for you.




Comments
Log in or sign up to join the conversation.