

EUR/USD
4 hour
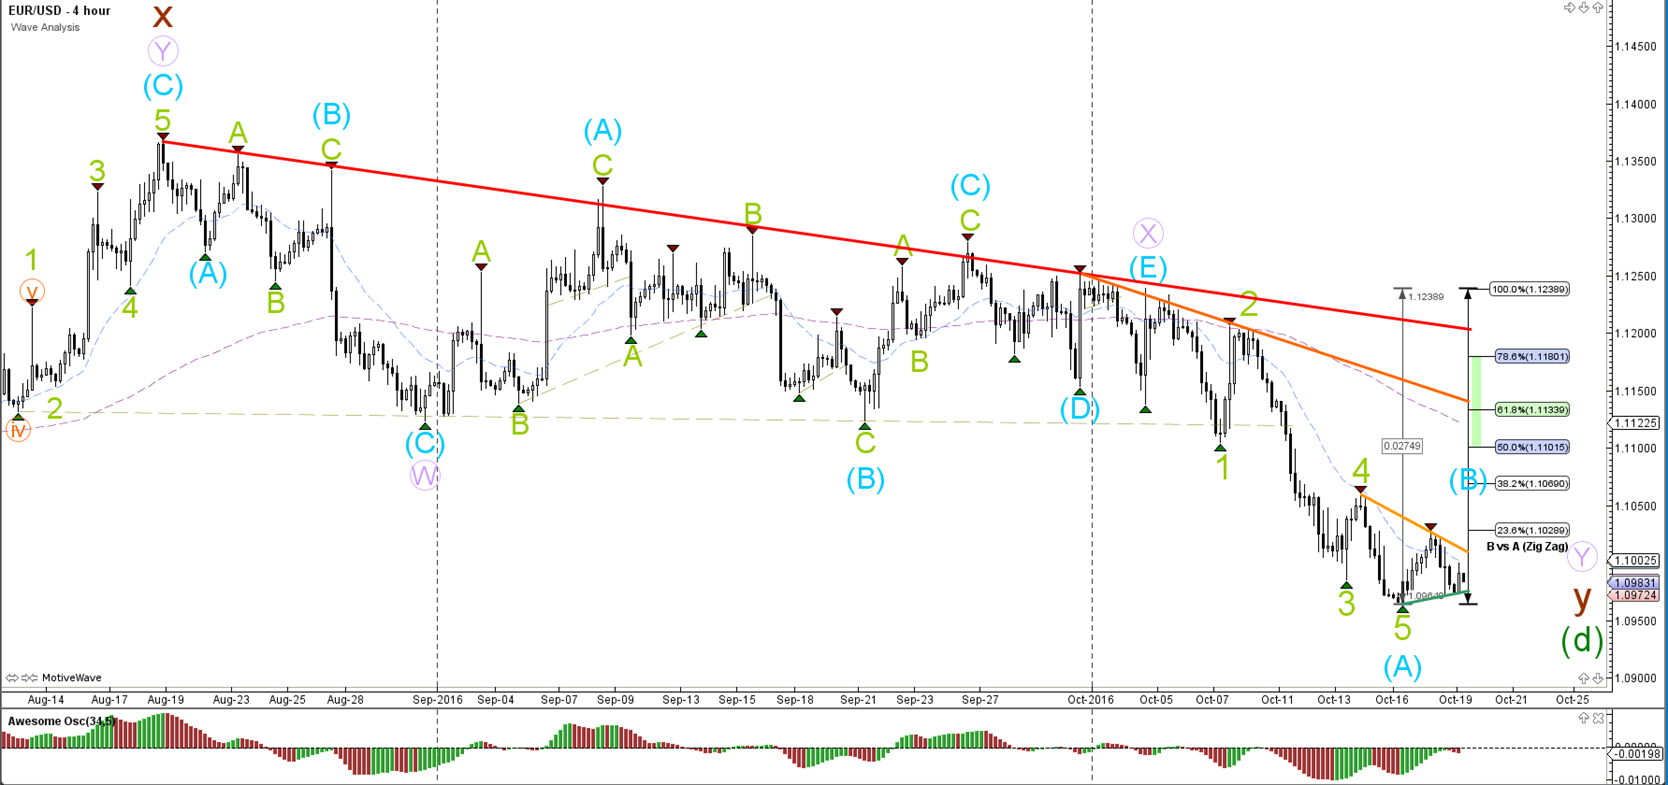
The EUR/USD turned at the 23.6% Fibonacci level of wave B vs A. However the bullish retracement could extend to higher Fibonacci levels if price breaks above the resistance trend line (orange). A break below support (green) could see a continuation of the downtrend.
1 hour
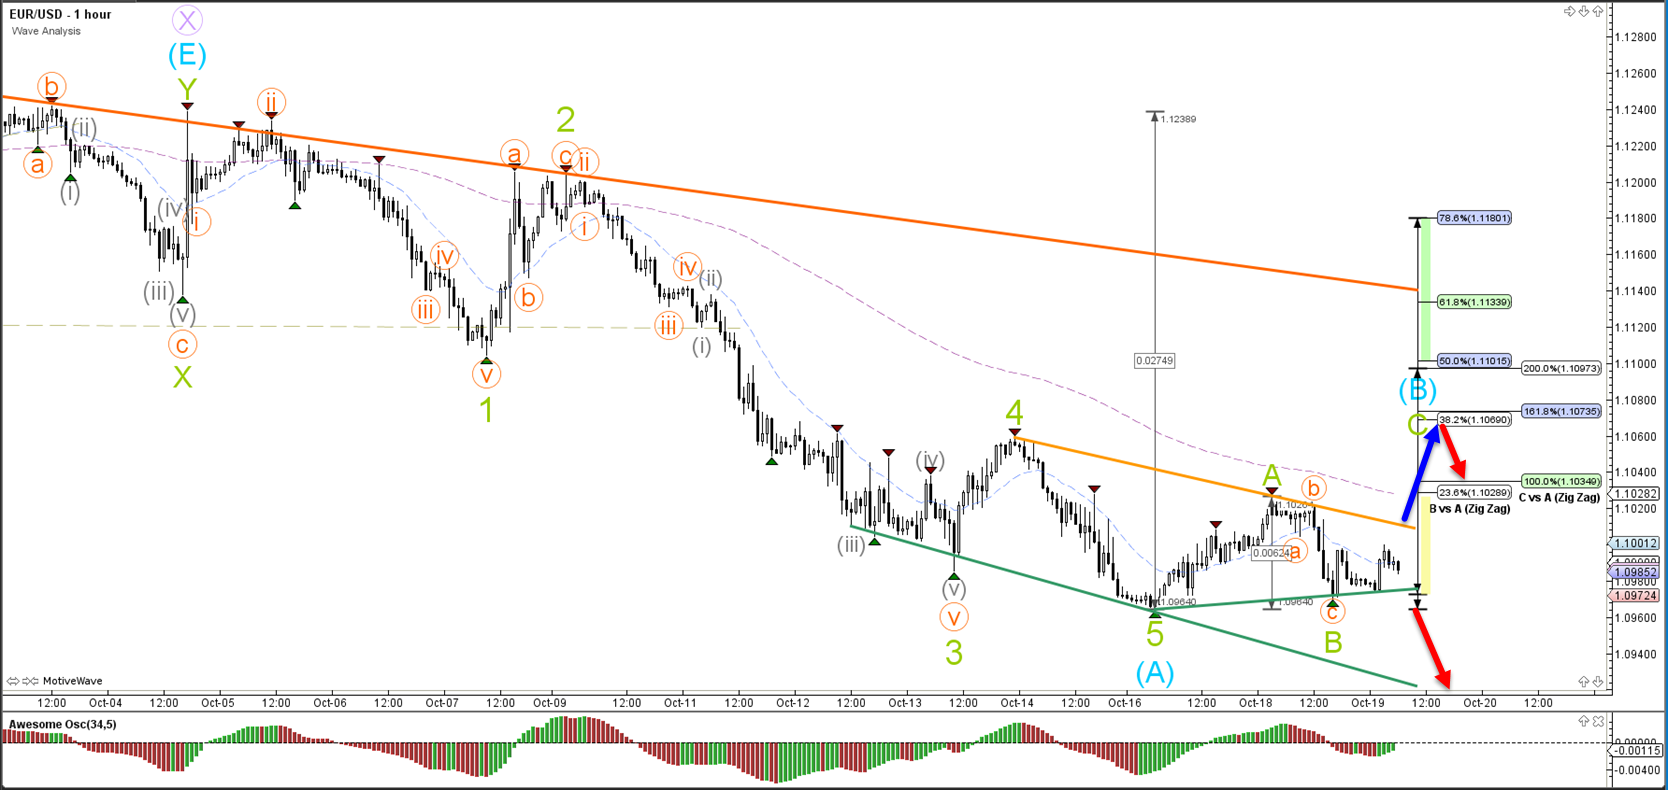
A bullish ABC (green) could to be taking place within wave B (green). The Fibonacci levels are targets and potential bouncing spots unless price breaks below the support trend line (green) that is connecting wave A (blue) and wave B (green).
GBP/USD
4 hour

The GBP/USD continues to build a triangle formation within the wave 4 (green) correction as the Cable breaks above resistance (dotted red). The Fib levels are expected to act as resistance.
1 hour

The GBP/USD is building a wave C (orange) within wave Y (blue). Currently a wave 4 (grey) correction could be developing unless price breaks below the 61.8% Fib level of wave 4 vs 3. A break above resistance (orange) could see price move towards Fibonacci targets.
USD/JPY
4 hour
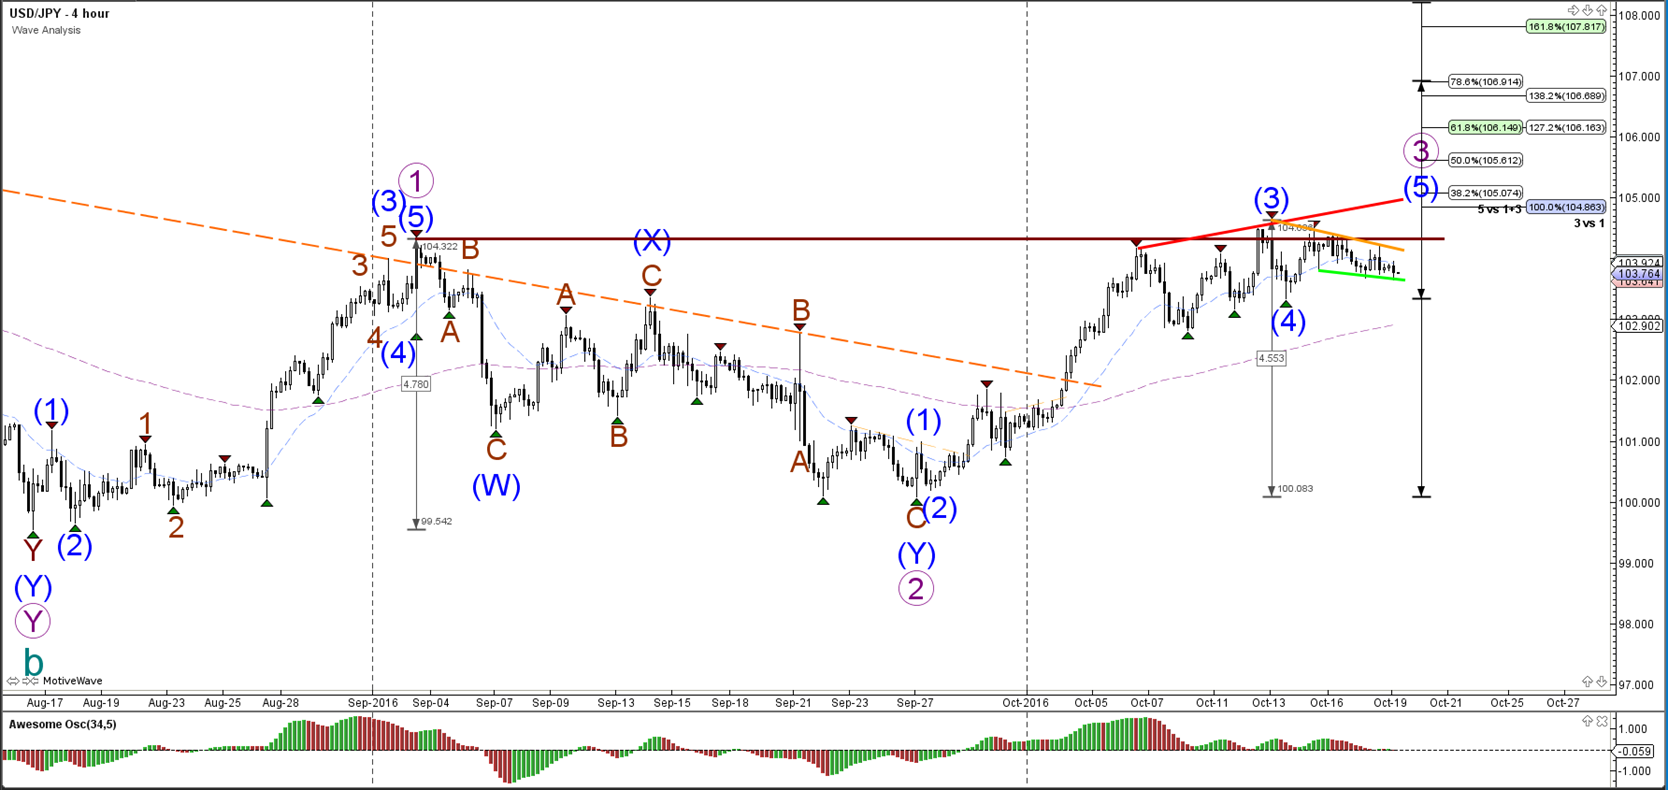
The USD/JPY needs to break above the previous of wave 1 (purple) before a larger uptrend (wave 3 purple) can start.
1 hour

The USD/JPY is developing a corrective chart pattern. A break above resistance (red/orange) is needed before price can build wave 3 (brown) and continue with the uptrend.



Comments
Log in or sign up to join the conversation.