

Bullish view
Buy the GBP/USD pair and set a take-profit at 1.3350.
Add a stop-loss at 1.3200.
Timeline: 1-2 days.
Bearish view
Sell the GBP/USD pair and set a take-profit at 1.3200.
Add a stop-loss at 1.3350.
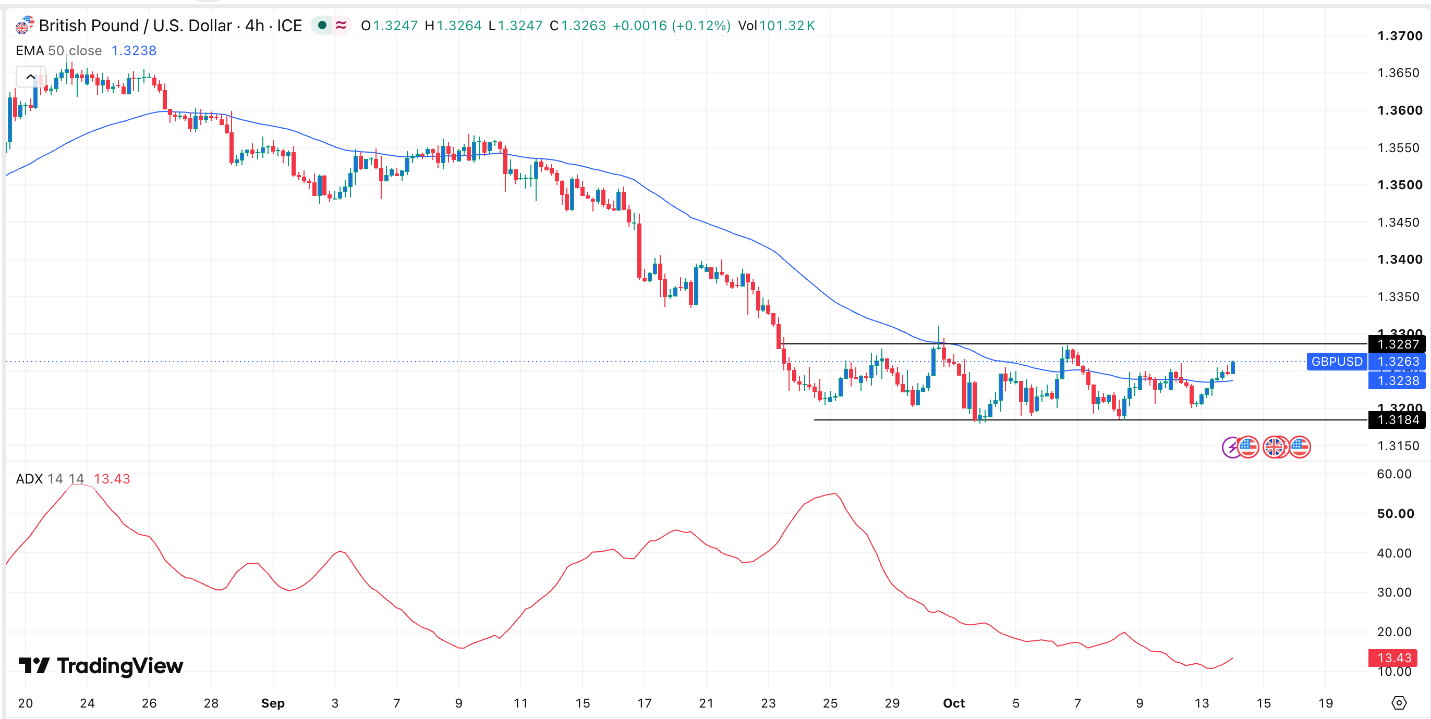
The GBP/USD pair rose slightly, reaching its highest level since October 7 as investors waited for important macro data from the US and the UK. It rose to 1.3260, 0.60% above the lowest level this month.
US Inflation and UK GDP Data
The next two days will be crucial for the upcoming US inflation and UK GDP numbers. Economists expect the upcoming report to show that the headline Consumer Price Index (CPI) rose from 3.4% in August to 3.6% in September. Core inflation, which excludes the volatile food and energy products, is expected to come in at 2.5%.
After that, the US will release the September retail sales report. Economists expect the upcoming report to show that retail sales rose 0.3% in September after rising by 1.2% in the previous month. Core sales are expected to move from 1.4% to 0.5%. The other top data to watch this week will be the initial and continuing jobless claims and the New York manufacturing index report.
Kevin Warsh, the Federal Reserve Chair, will deliver a statement on Thursday, providing hints on what to expect in the last two meetings of the year. His statement comes as inflation remains substantially higher, a trend that may continue as energy prices rise. Brent, the global benchmark, rose to $107, while the West Texas Intermediate (WTI) rose to $95.
The GBP/USD pair will next react to the upcoming UK GDP and manufacturing reports on Thursday. These numbers will provide more hints on the state of the economy. In a recent report, the IMF boosted its UK economic outlook, citing the ongoing AI buildup in the country. Economists already expect the BoE to hike interest rates.
GBP/USD Technical Analysis
The four-hour chart shows that the GBP/USD pair formed a strong bottom at 1.3184 earlier this month. It found a strong support level at that price. It has now moved slightly above the 50-period Exponential Moving Average (EMA).
At the same time, the Relative Strength Index (RSI) has drifted upwards, while the Average Directional Index (ADX) has started going upwards. Therefore, the pair will likely continue rising, potentially to the key resistance level of 1.3350. This view will be confirmed if it moves above the key resistance level of 1.3287.


Comments
Log in or sign up to join the conversation.