

Bearish view
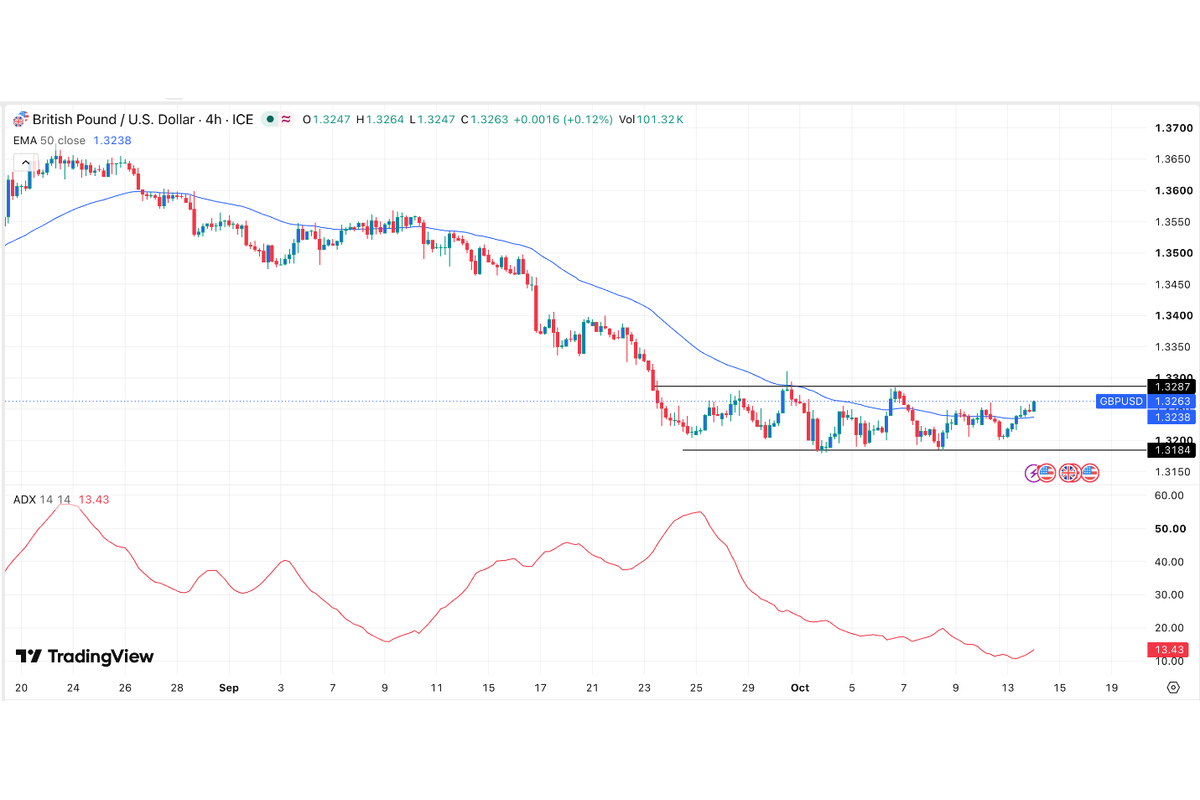
Sell the GBP/USD pair and set a take-profit at 1.3100.
Add a stop-loss at 1.3255.
Timeline: 1-2 days.
Bullish view
Buy the GBP/USD pair and set a take-profit at 1.3255.
Add a stop-loss at 1.3100.
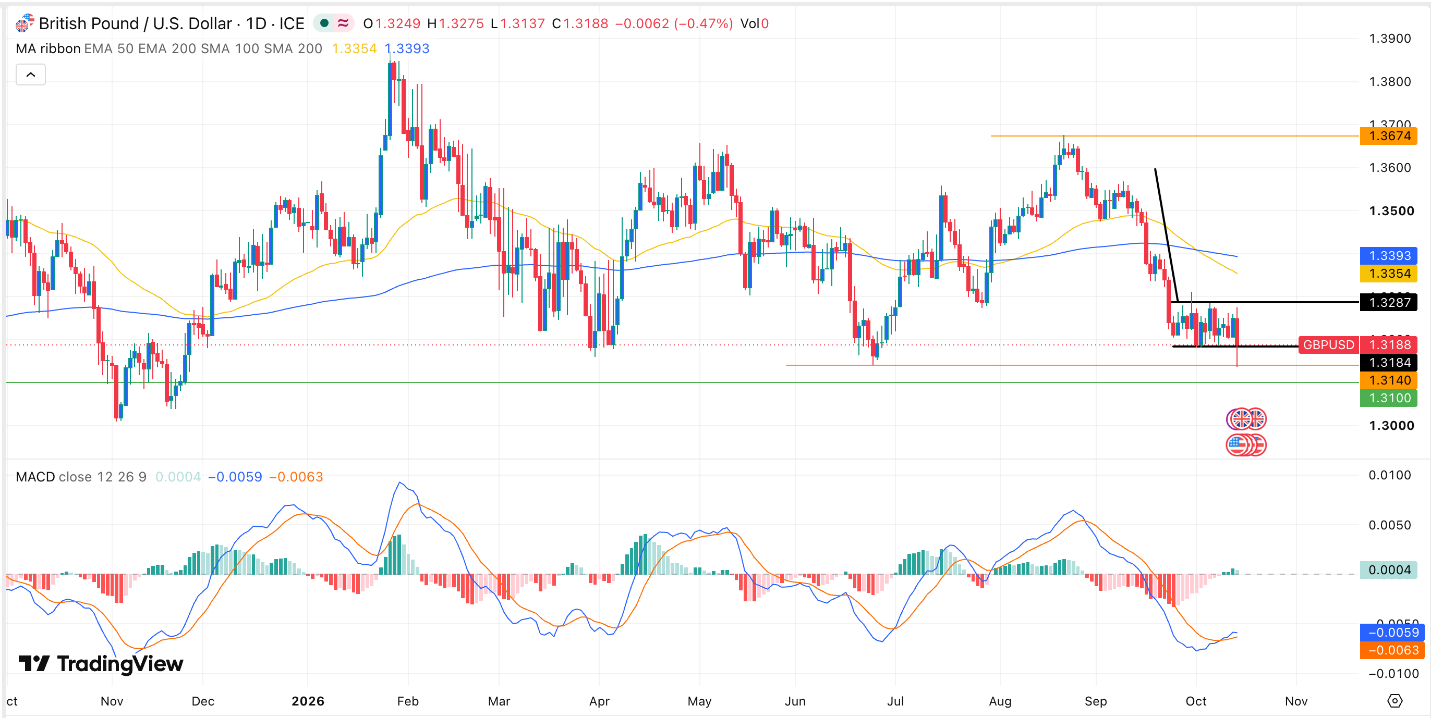
The GBP/USD pair fell to its lowest level since June 24 as the US dollar surged after the latest US consumer inflation report. The pair slipped to 1.3140, nearly 4% below its September highs, and the sell-off could extend in the near term.
US Dollar Jumps as Fed Rate Hike Jumps
The GBP/USD pair dropped sharply as the US dollar and bond yields rose after the strong inflation report. This report showed that the headline Consumer Price Index (CPI) rose from 0.4% in August to 0.6% in September. This increase led to an annualized growth of 3.7%, higher than the median estimate of 3.6%.
The closely watched core inflation rose 0.3% in September, higher than the expected 0.2%, with its annual figure moving from 2.4% to 2.6%. These numbers mean that inflation has remained above the Federal Reserve’s target of 2.0%.
Inflation has remained steady because of Donald Trump’s tariffs and the ongoing US-Iran war that has pushed oil prices higher. Brent, the global benchmark, is trading at $105, while the West Texas Intermediate (WTI) moved to $95. Oil may continue rising in the near term as the crisis in the Middle East escalates.
The GBP/USD pair will next react to the upcoming US retail sales, which will provide hints on the health of the US consumer. The expectation is that retail sales rose by 0.3% in September from 1.1% a month earlier. Further, the US will publish the latest initial and continuing jobless claims numbers, while Kevin Warsh will talk at an IMF gathering.
The GBP/USD pair will also react to the latest UK GDP report. Economists expect the data to show that the economy slowed by 0.1% in August after growing by 0.4% a month earlier. This report comes a few days after the IMF upgraded the UK GDP estimate, citing the ongoing AI investments.
GBP/USD Technical Analysis
On the charts, the GBP/USD pair has slumped in the past few weeks. It dropped from 1.3674 on August 21 to a low of 1.3140 on Wednesday. Its lowest level this week was notable because it coincided with the lowest level on June 24.
The pair has formed a bearish flag pattern, which is made up of a vertical line and a horizontal channel. It has also remained below the 50-day moving average. Therefore, the pair will likely continue falling, potentially to the support level of 1.3100, its lowest level on November 25 last year.
Comments
Log in or sign up to join the conversation.