

GBP/USD Daily Chart
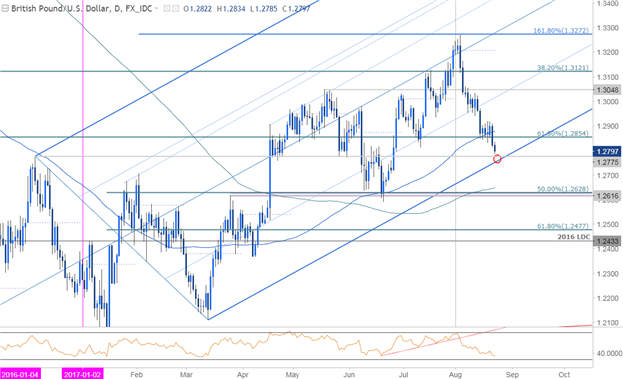
Technical Outlook: Last week we highlighted that ‘GBP/USD has been trading within the confines of an ascending pitchfork formation dating back to last year with an outside-day reversal at the highs shifting our focus lower earlier this month. Prices broke below slope support today with the decline now testing the 61.8% retracement at 1.2850.’
Prices sat on that level into the close of the week with a break yesterday now targeting more significant structural support at the December high / lower parallel at 1.2760/75- a level of interest for possible exhaustion. A break below this threshold would risk a drop towards the 200-day moving average / 50% retracement at 1.2628/45.
GBP/USD 120min
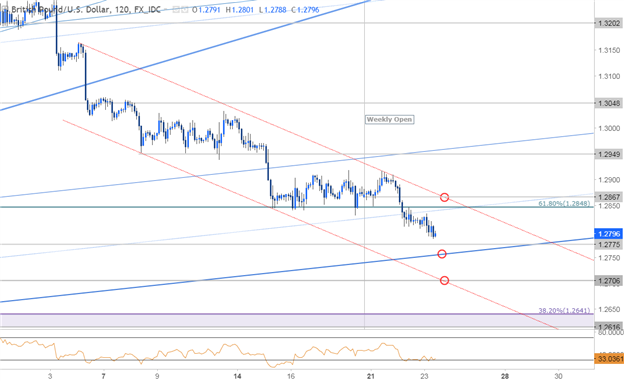
Notes: A closer look at price action shows cable trading within an embedded descending channel with the upper parallel converging on the weekly open at 1.2867-a breach above this region would be needed to mark a near-term reversal in the pair with such a scenario eying initial targets at1.2949.
That said, the immediate risk is lower and from a trading standpoint, I would be looking for a dip into the lower parallel for possible exhaustion / long-entries. A break below 1.27 would suggest the larger construct has been compromised and would keep the broader downside bias in play targeting 1.2641 & 1.2616.
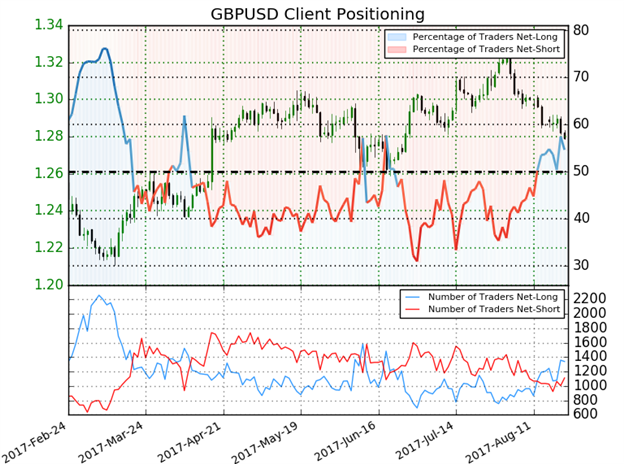
- A summary of IG Client Sentiment shows traders are net-long GBPUSD- the ratio stands at +1.21 (54.7% of traders are long) – weak bearish reading
- Long positions are 8.9% higher than yesterday and 9.1% higher from last week
- Short positions are 8.6% higher than yesterday and 2.3% higher from last week
- We typically take a contrarian view to crowd sentiment, and the fact traders are net-long suggests GBPUSD prices may continue to fall. Traders are further net-long than yesterday and last week, and the combination of current sentiment and recent changes gives us a stronger GBPUSD-bearish contrarian trading bias.
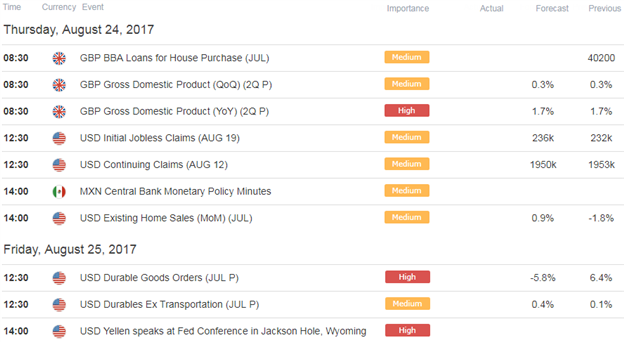
Relevant Data Releases



Comments
Log in or sign up to join the conversation.