

GBPUSD has carved out an inverted head and shoulders pattern since mid-June, with the head forming near the 1.3140 lows and the shoulders taking shape on either side around the 1.3300 region.
Price recently broke above the neckline resistance near 1.3480 with a strong bullish candle, confirming the pattern and signaling that a reversal from the prior downtrend is underway.
The breakout candle pushed price up to 1.3534, and if the pair can sustain gains above the neckline, a measured move projection derived from the pattern’s height suggests GBPUSD could aim for the 1.3820 region next. This would be calculated by adding the distance between the head and the neckline to the breakout point.
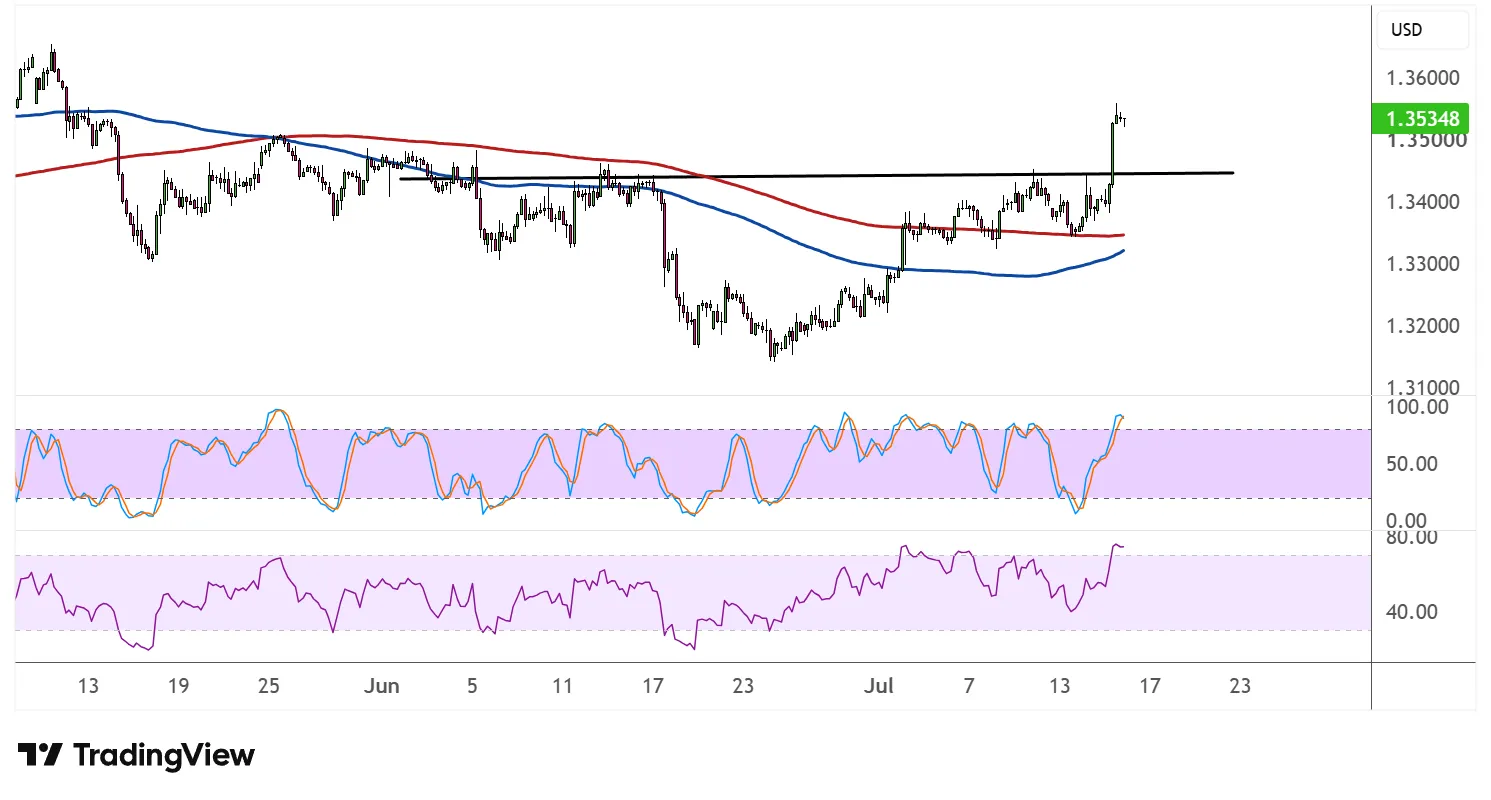
The 100 SMA has been curling higher and is starting to close the gap with the 200 SMA, which remains above for now. However, price is now trading above both indicators, a shift that could see the 100 SMA cross above the 200 SMA soon and reinforce the case for sustained bullish momentum.
Stochastic recently emerged from the oversold zone and is now testing the overbought region, reflecting the strength of the recent rally. The oscillator has limited room left before reaching overbought territory, so a slight pullback could occur, although this might simply offer a fresh opportunity for buyers to hop back in near the broken neckline.
RSI is also climbing towards the overbought area, mirroring the improvement in bullish momentum following the breakout. As long as the indicator holds above the midpoint, buyers are likely to remain in control.
A pullback that holds above the former neckline resistance, now potential support, could validate the pattern and pave the way for the measured move rally towards 1.3820 or higher. On the other hand, a failure to hold above this level could stall the advance and cast doubt on the bullish reversal.



Comments
Log in or sign up to join the conversation.