

GBPUSD has been trending lower inside a descending channel on the short-term time frame, with price recently breaking down sharply from the channel midpoint and falling to fresh lows near the 1.3150 area.
The pair is currently attempting a bounce from this swing low, which lines up with a minor psychological support, but the broader structure still favors the bears.
The Fibonacci retracement tool drawn from the recent swing high to the swing low highlights where sellers could be waiting to re-enter the downtrend. The 38.2% Fib is at 1.3270, while the 50% level sits at 1.3306.
A larger correction could reach the 61.8% Fib at 1.3343, which broadly coincides with the descending channel’s upper boundary and could serve as the line in the sand for a bearish pullback. The 100% Fib level at 1.3462 marks the origin of the most recent leg lower and represents a full retracement of the move.
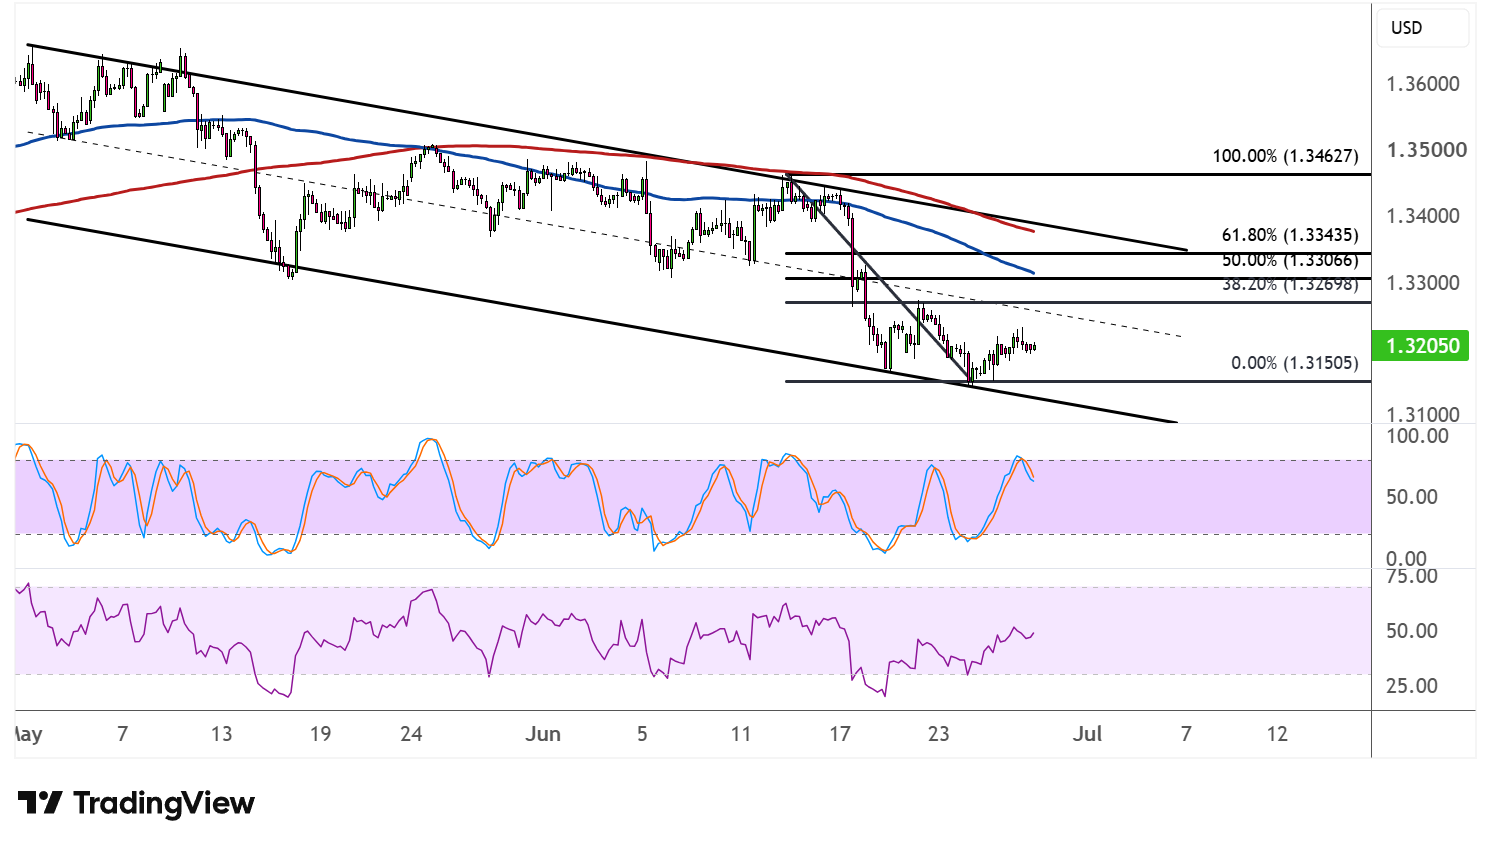
The 100 SMA is below the 200 SMA to confirm that the path of least resistance is to the downside. Both indicators are sloping lower and pressing down on price from above, with the gap between them reflecting sustained bearish momentum.
Stochastic is turning higher from near the oversold region, suggesting that a short-term corrective bounce could be underway. The oscillator has room to climb before reaching the overbought area, which could give the pair enough lift to test the Fibonacci retracement levels above.
RSI is also edging higher from relatively depressed levels, with room to advance before reaching overbought territory. This supports the case for a temporary pullback before sellers potentially reassert control.
If any of the Fib levels hold as a ceiling, GBP/USD could resume the slide toward the swing low at 1.3150 or lower. A break above the 61.8% Fib, however, could signal a more meaningful recovery is underway.
GBPUSD could take cues from pre-NFP positioning and risk sentiment, as markets are gearing up for a shortened trading week ahead of the Fourth of July.



Comments
Log in or sign up to join the conversation.