

The GBP/USD pair trades on a flat note around 1.3415 during the early European trading hours on Friday. Traders prefer to wait on the sidelines ahead of the release of the monthly UK Gross Domestic Product (GDP).
The UK economy is expected to contract by 0.1% in April, compared to an expansion of 0.3% in the previous reading. If the report shows a stronger-than-expected outcome, this could underpin the British Pound (GBP) against the US Dollar (USD) in the near term.
On the other hand, uncertainty in the Middle East could boost a safe-haven currency such as the Greenback and act as a headwind for the major pair. Fox News reported on Friday that US forces intercepted and shot down two Iranian one-way attack drones near the Strait of Hormuz after Iran attempted to target commercial vessels transiting the waterway.
Technical Analysis:
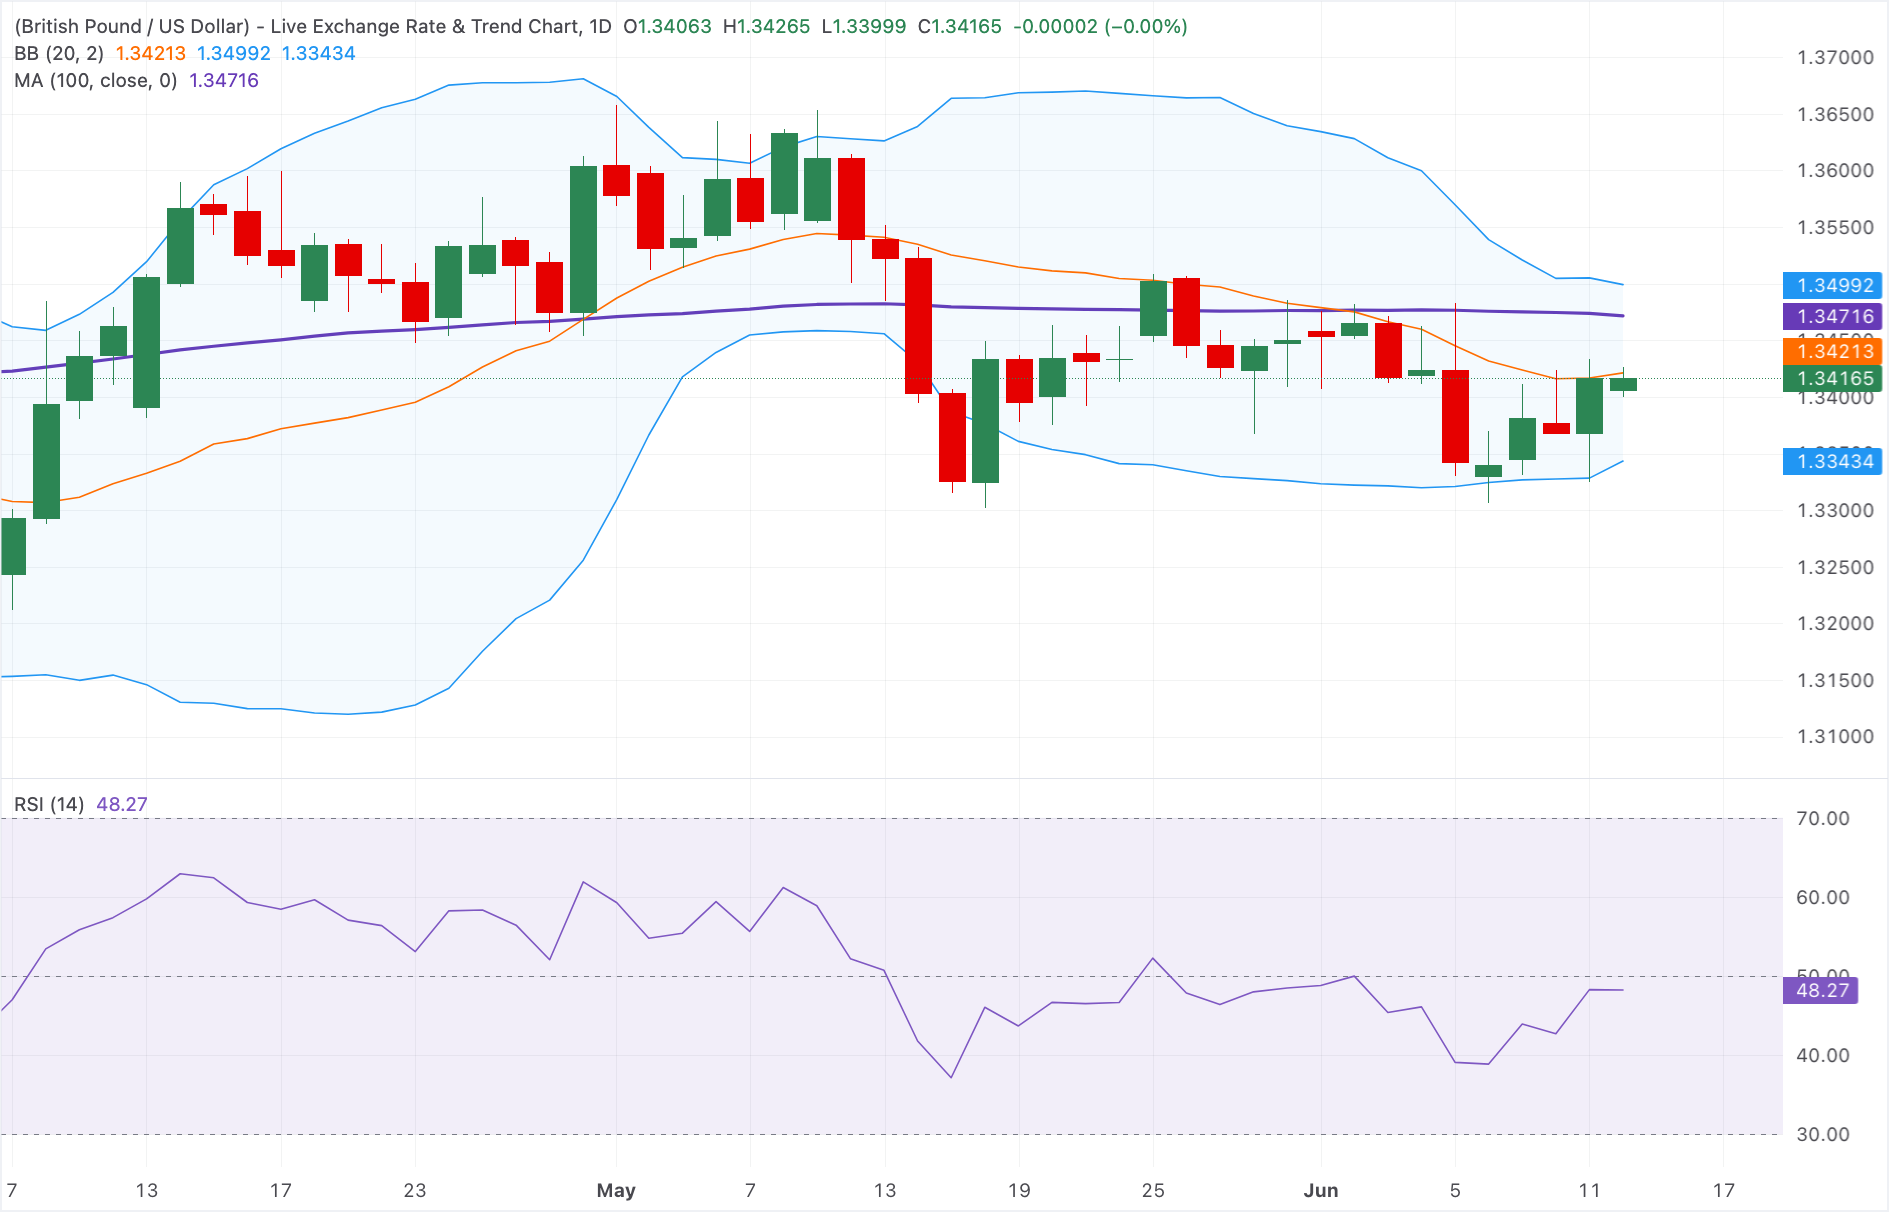
In the daily chart, GBP/USD trades with a mildly bearish near-term bias, holding under the 100-day simple moving average (SMA) and the Bollinger upper band. Price is also fractionally below the Bollinger middle band, keeping spot capped by nearby dynamic resistance, while the Relative Strength Index (RSI) at 48 leans neutral and suggests a consolidative tone rather than impulsive selling for now.
On the topside, initial resistance is located at the Bollinger middle band around 1.3420, followed by the 100-day SMA at 1.3472, with the upper Bollinger band near 1.3500 reinforcing a wider supply zone. On the downside, the next notable support is the lower Bollinger band around 1.3343, where a break would open the door to a deeper retracement within the broader range.


Comments
Log in or sign up to join the conversation.