
EUR/USD
4 hour
(Click on image to enlarge)
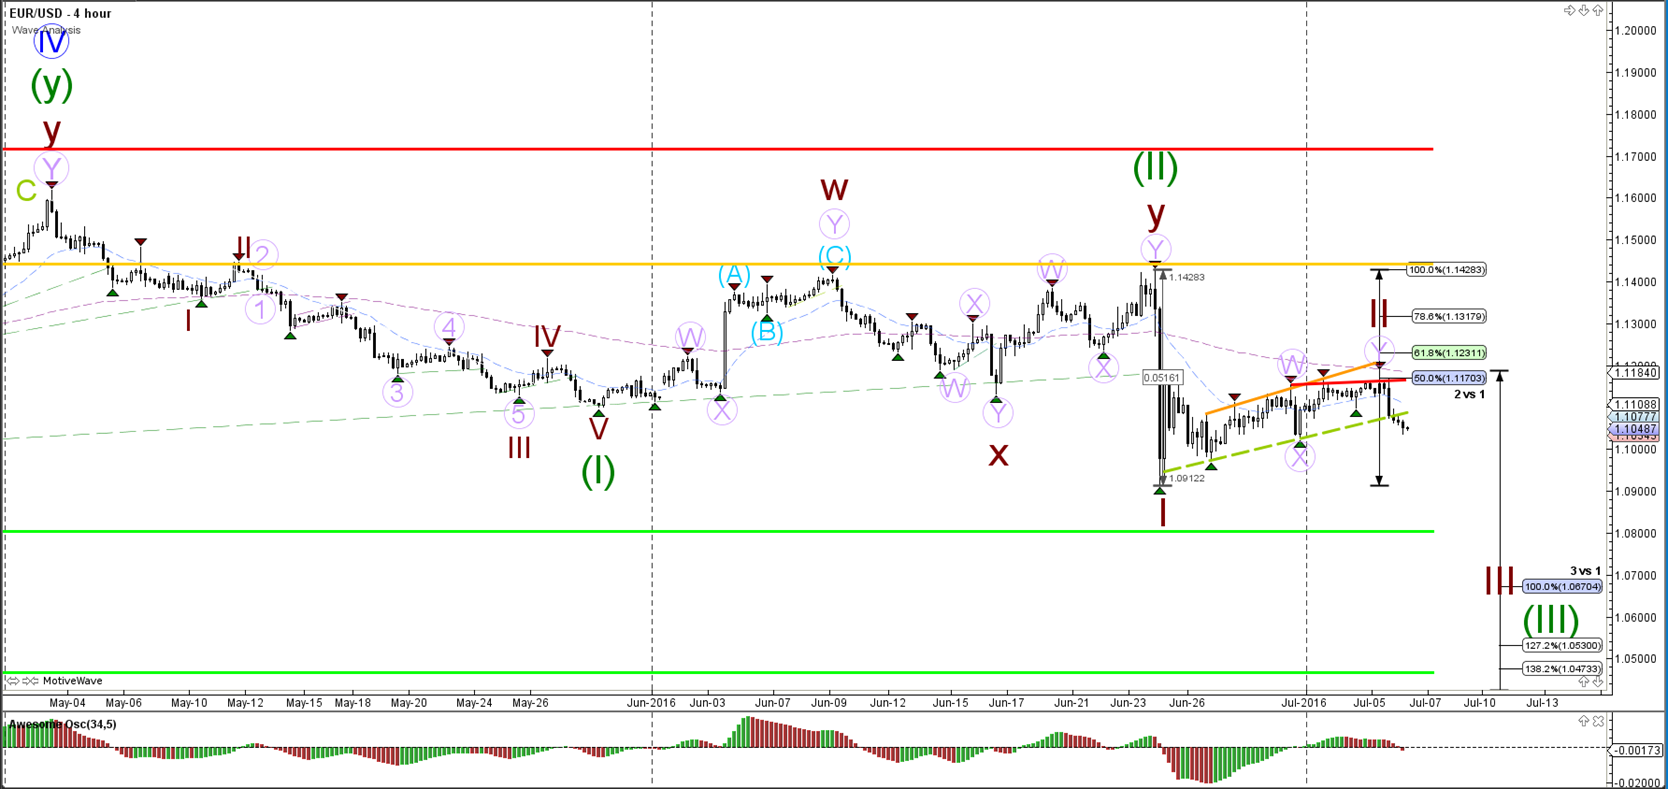
The EUR/USD is breaking below the support trend line (dotted green) after bouncing at the 50% Fibonacci retracement level of wave 2 (brown). Price could now fall to challenge the 1.08 support level (green). A wave 3 (brown) becomes more likely if price manages to break below that support and the 100% Fibonacci target of wave '3 vs 1'.
1 hour
(Click on image to enlarge)
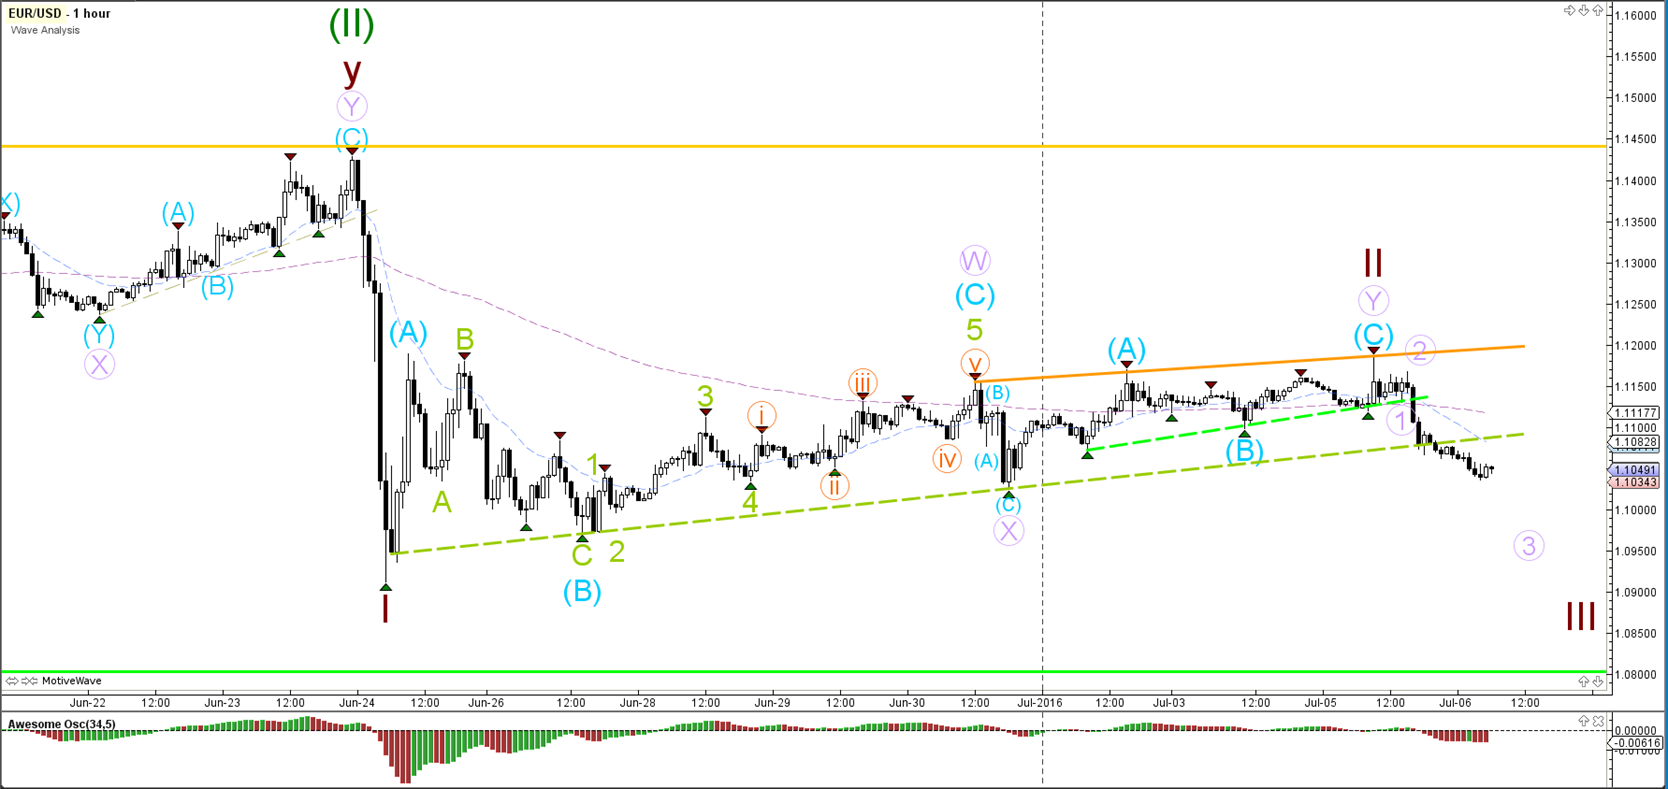
The EUR/USD wave 3 (purple) is invalidated if price were to break above the top of waves 2 (brown/purple).
GBP/USD
4 hour
(Click on image to enlarge)
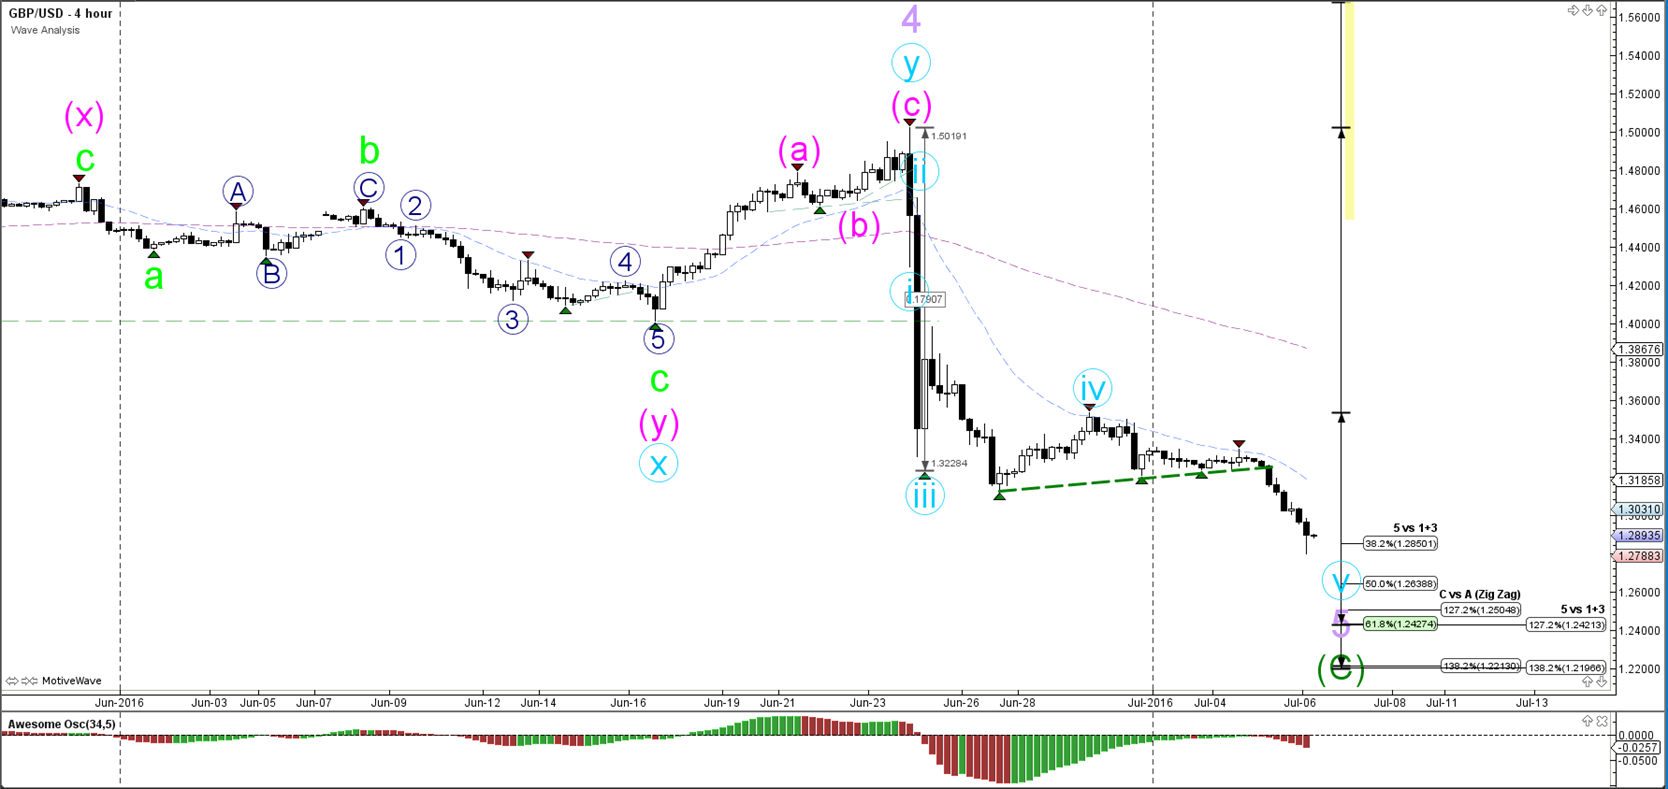
The GBP/USD broke the consolidation pattern by pushing below the support trend line (dotted green). Price is now in a bearish momentum heading towards the bearish Fibonacci targets.
1 hour
(Click on image to enlarge)
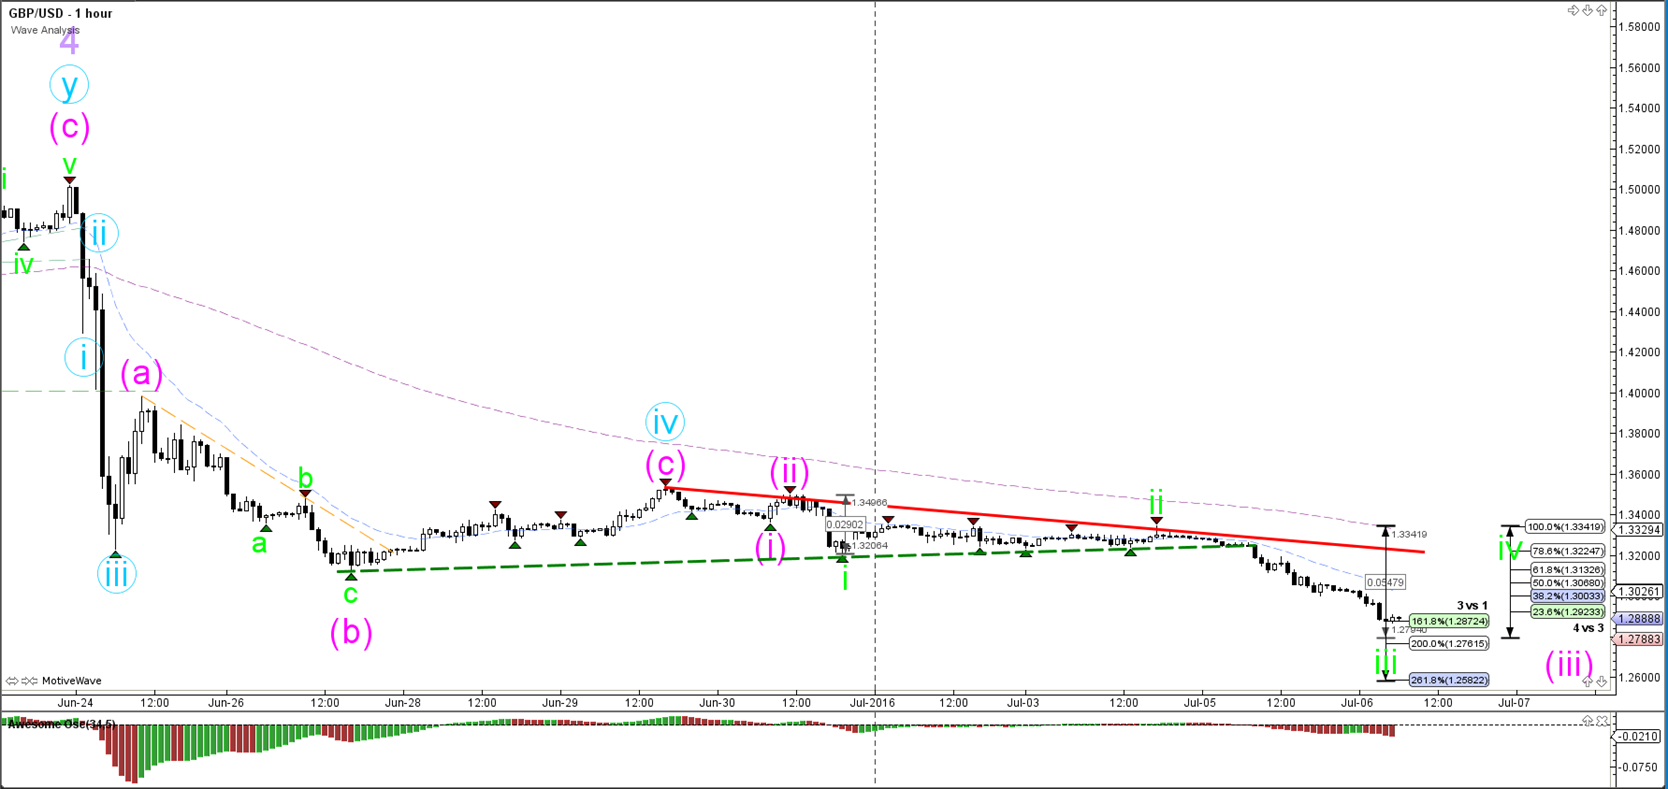
The GBP/USD has reached the 161.8% Fibonacci target of wave '3 vs 1', which could be the spot where a wave 3 (green) is completed. In that case price could retrace for a wave 4 (green) back to the Fibonacci retracement levels. The other scenario is that price continues with the bearish momentum towards the next Fibonacci targets of wave '3 vs 1'.
USD/JPY
4 hour
(Click on image to enlarge)
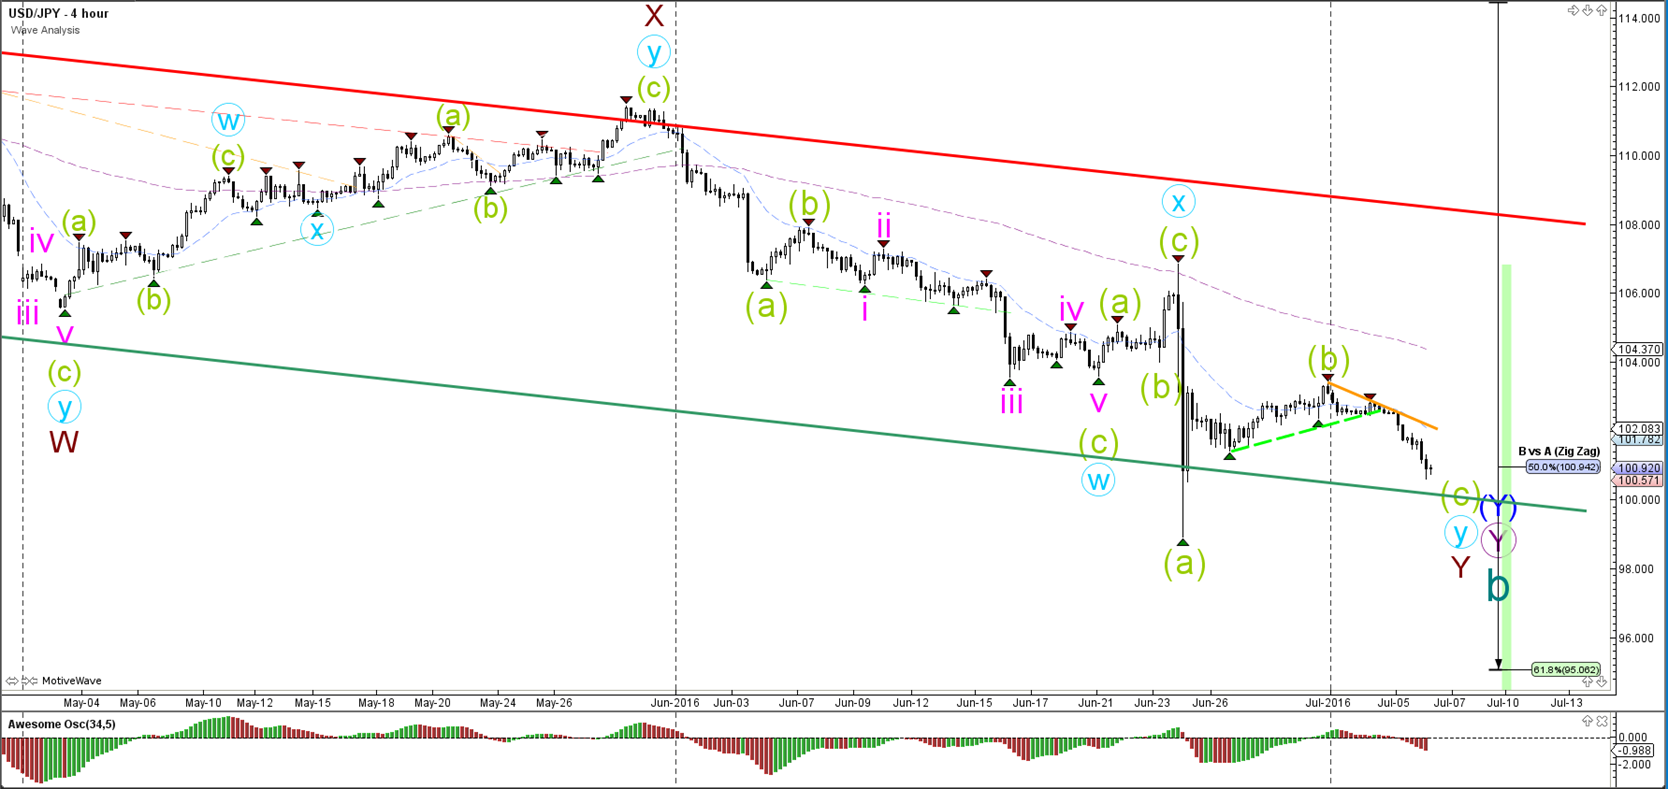
An USD/JPY break below the 100 price level increases the chances of a breakout towards the 61.8% Fibonacci support at 95 whereas a bounce at or above 100 could indicate a larger wave B (green) or a change of wave structure (once above 100% at 106.84).
1 hour
(Click on image to enlarge)
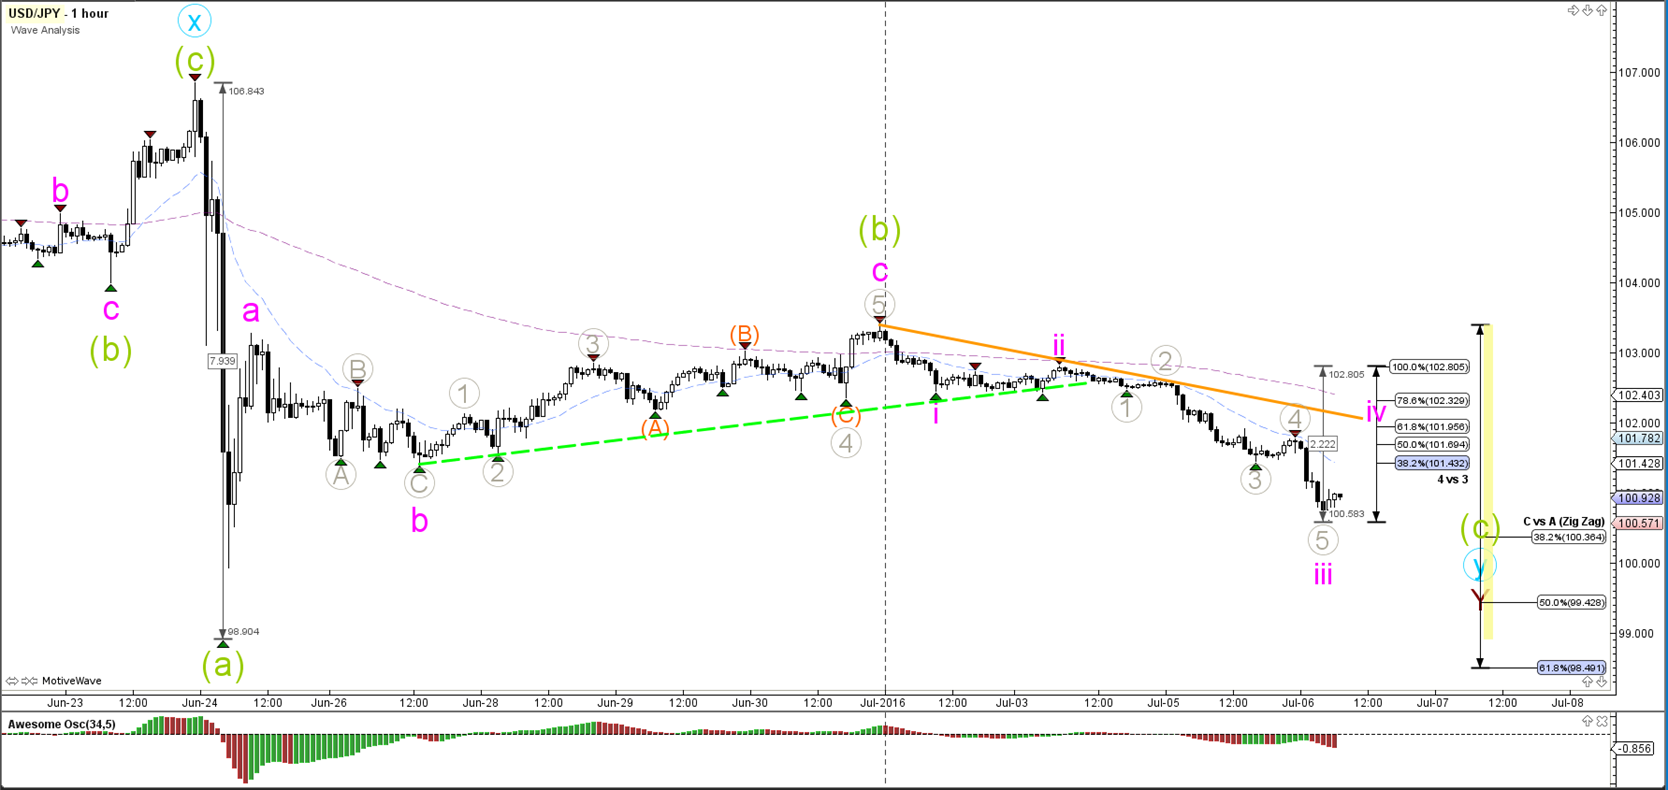
If the USD/JPY could have completed wave 3 (pink), then price is expected to retrace back to the Fibonacci levels of wave 4 (pink). The invalidation level is the 78.6% Fib of wave '4 vs 3' but the most common Fibs are 38.2% and 50%. The other scenario is that price continues with the bearish momentum towards the next Fibonacci targets of wave 'C vs A'.


Comments
Log in or sign up to join the conversation.