

On Thursday, the GBP/USD currency pair extended the current week’s declines to trade at about 1.3232. The pullback follows Wednesday’s downward breakout from an ascending channel formation in the 60-minute chart.
The pair has since plummeted to trade several levels below the 100-hour moving average line. As a result, the currency pair entered the oversold levels of the 14-hour RSI.
GBP/USD Fundamentals Overview
From a fundamental perspective, the GBP/USD currency pair trades during a relatively busy period in both markets. On Thursday, the UK’s claimant count change for May increased to 31.2k, up from 8.3k in April, missing the forecasted change of 25.8k. On the other hand, the average earnings excluding bonuses for the three months to April beat the (YoY) expectation of 3.2%, with a change of 3.4%. The average earnings, including bonuses, for the period also outshone the forecasted change of 4%, with a change of 4.4%.
Elsewhere, the 3-month employment change in April fell to 100k, down from the 148k, beating the forecasted change of 80k. The ILO unemployment rate for the period also came in better than expected, at 4.9% versus a forecast of 5%, down from 5%.
In the US, the Federal Reserve kept the base interest rate unchanged at 3.75% as expected on Wednesday. On the other hand, retail sales for May exceeded the forecasted (MoM) change of 0.5%, with a change of 0.9%. The retail sales ex-autos for the month also beat the (MoM) expectation of 0.5%, with a change of 0.8%, while the pending home sales for the period outshone the forecasted change of 0.8%, with a change of 3.8%.
GBP/USD Technical Analysis (the 60-min Chart)
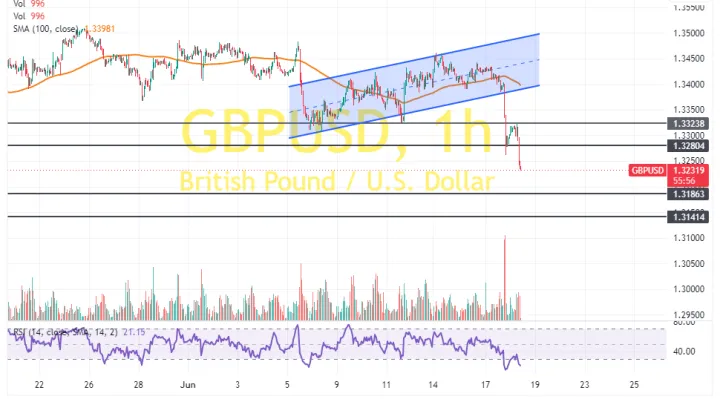
Technically, the GBP/USD currency pair has recently completed a downward breakout from an ascending channel formation in the 60-minute chart. The 14-hour RSI has also plummeted into oversold conditions.
Therefore, the bears will look to stretch the latest pullback towards 1.3186 or lower to 1.3141. On the other hand, the bulls will look to pounce on rebounds at about 1.3280 or higher at 1.3323.
GBP/USD Technical Analysis (the Daily Chart)
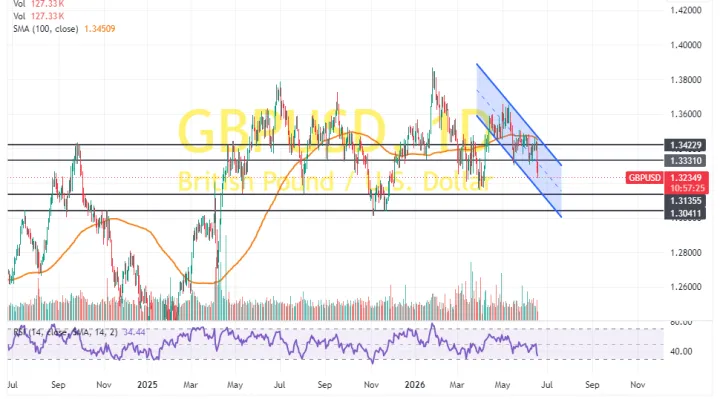
In the daily chart, the GBP/USD currency pair trades within a descending channel formation. The 14-day RSI also supports a long-term bearish bias as it edges closer to oversold conditions.
Therefore, the bears will look to extend the current declines toward 1.3135 or lower to 1.3041. On the other hand, the bulls will look to pounce on rebounds at about 1.3331 or higher at 1.3423.



Comments
Log in or sign up to join the conversation.