

GBPUSD continues to show an incomplete bearish sequence from the January 27, 2026 high, keeping the bias tilted lower. The potential target can be measured using the 100% to 161.8% Fibonacci extension from that peak. This calculation defines a zone between 1.252 and 1.295, which remains the key area of interest for traders. The near‑term structure supports this view, as the decline from the May 1 high is unfolding as a five‑wave impulse. From May 1, wave 1 ended at 1.33, while the corrective rally in wave 2 concluded at 1.35. The pair then resumed its downward path in wave 3, reaching 1.314.
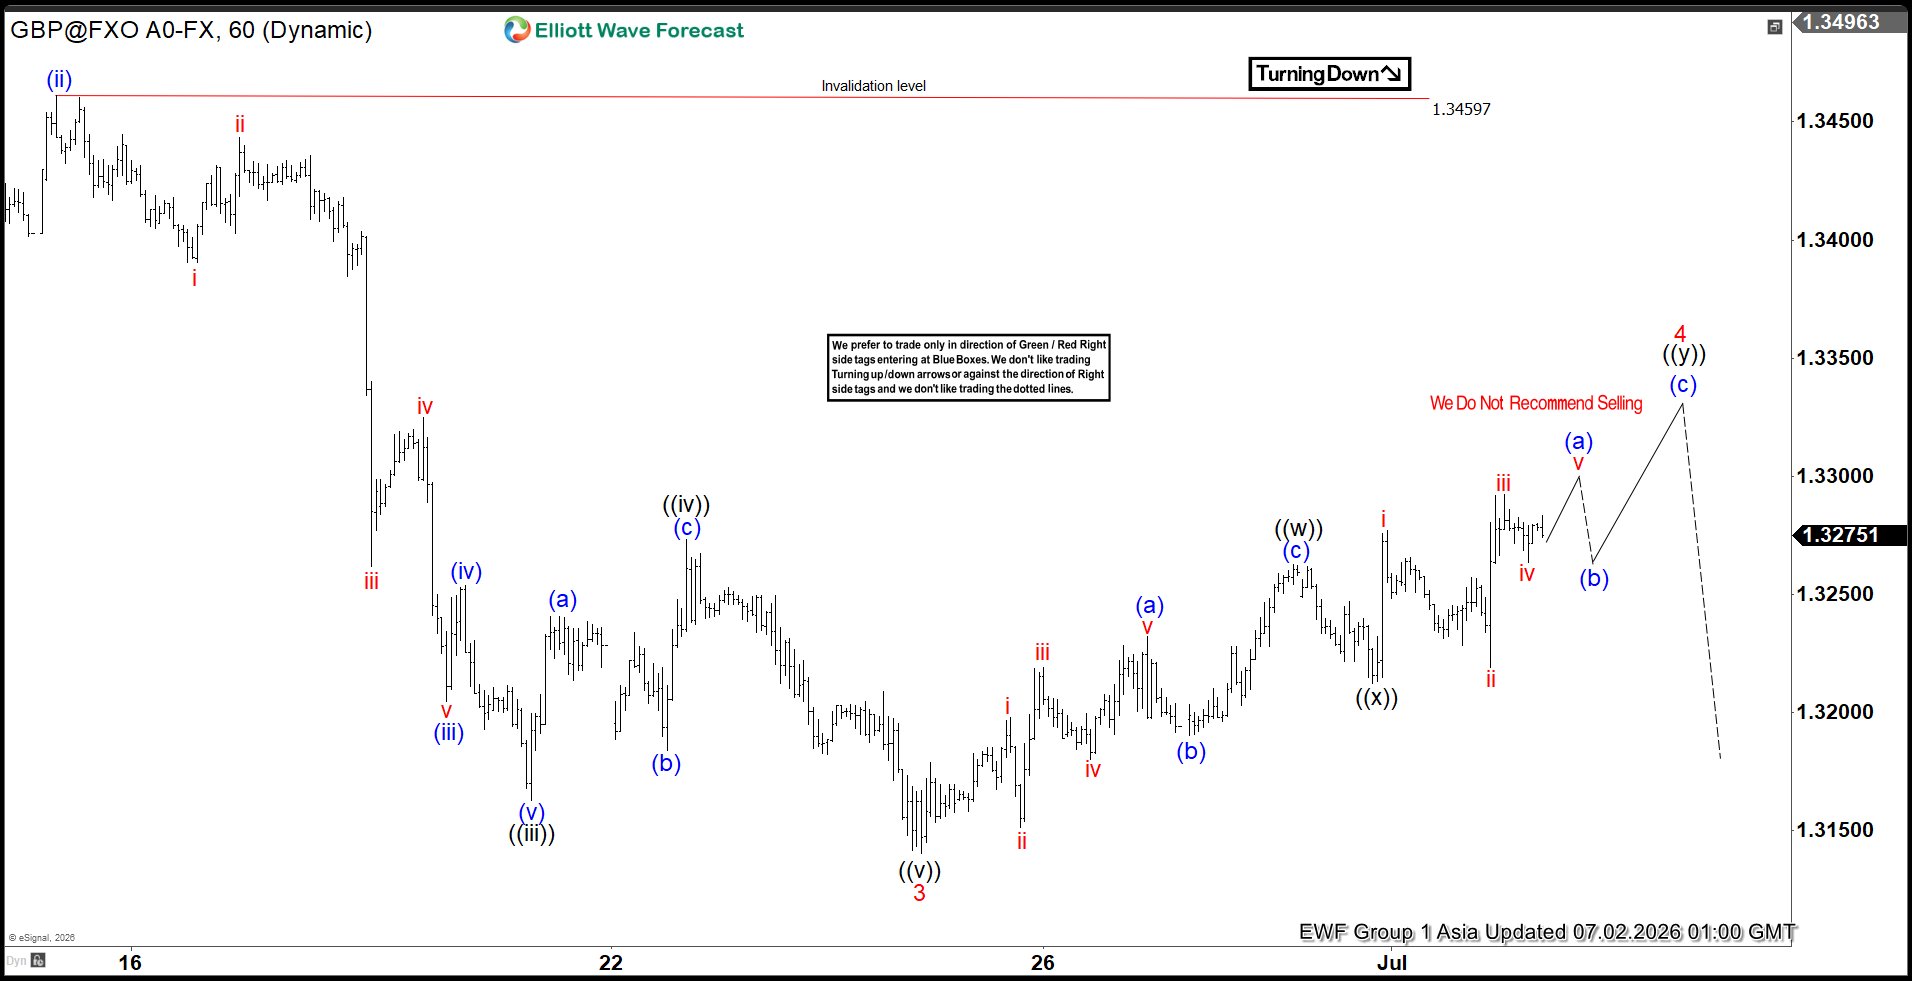
Wave 4 is now in progress and shows internal subdivision as a double three corrective structure. From the wave 3 low, wave ((w)) ended at 1.326, followed by a pullback in wave ((x)) that completed at 1.321. The pair then advanced in wave ((y)), which remains active and should extend further towards 1.33 to 1.34 before turning lower. This corrective rally is expected to be temporary, as the larger bearish sequence continues to dominate. As long as the pivot at 1.346 high stays intact, the rally should fail in seven swings and give way to renewed weakness. The overall technical picture reinforces the downside bias, suggesting GBPUSD is likely to extend its decline in line with the incomplete bearish sequence.
GBPUSD 60-Minute Elliott Wave Chart


Comments
Log in or sign up to join the conversation.