
US DOLLAR RALLY RUNS INTO RESISTANCE AT MONTHLY HIGHS
The week-long rally in the US Dollar has continued, and the currency is now trading above two resistance levels of note; testing above both the trend-line projection and the 96.47 Fibonacci level. This move has had reverberations through many FX pairs, with bearish themes showing more prominently in pairs like EUR/USD, GBP/USD, AUD/USD and NZD/USD.
The big question around the US Dollar at this point is for how long might bulls be able to push? A bit of resistance has started to show off of the late-January swing-high of 96.66, and a bit higher on the chart is another area of interest around 97.00. Inside of recent price action, that 96.47 level could be of interest for support themes; but given the deep overbought nature of RSI on shorter-term charts, prices may pose a deeper retracement before that bullish trend is ready to resume, and this can keep interest around the 96.30 and 96.04 levels for deeper zones of potential support.
US DOLLAR FOUR-HOUR PRICE CHART: OVERBOUGHT USD PULLS BACK FROM MONTHLY HIGHS
(Click on image to enlarge)
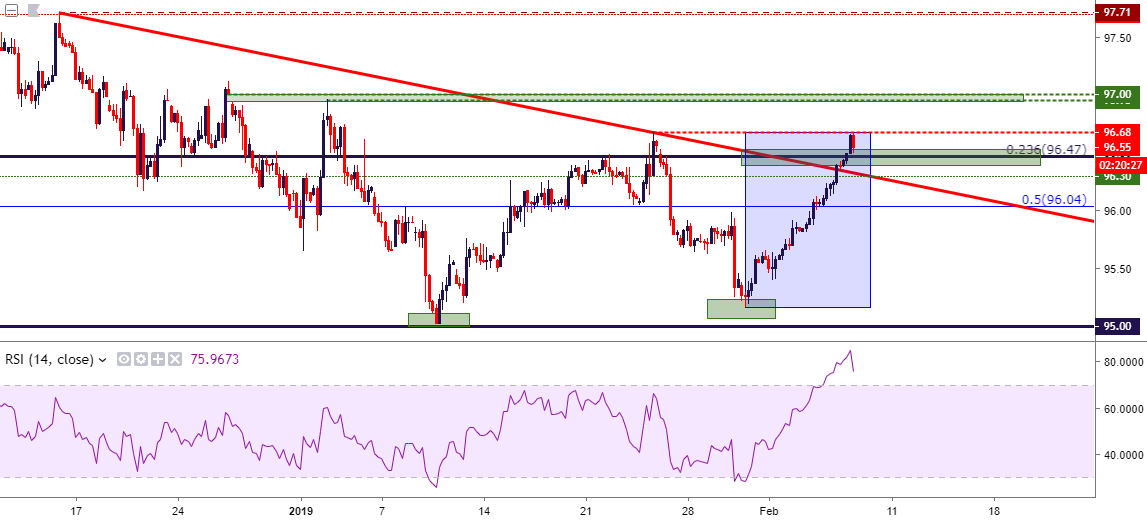
Chart prepared by James Stanley
GBP/USD DIPS THEN BOUNCES ON BOE
Going along with that Dollar-strength over the past week has been a reemergence of sellers in Cable. GBP/USD topped out around the 1.3200 level in late-January, and since then sellers have been getting more aggressive, posing two key support breaks so far this week. The 1.3000 level was taken-out on Monday, and after building in a day of support at the 1.2920 Fibonacci level, prices have sunk down to test the next potential zone that I looked at in yesterday’s article, spanning 1.2828-1.2850.
This morning’s drivers in GBP are emanating from the first ‘Super Thursday’ rate decision of 2019. The Bank of England cut growth forecasts, and Mr. Mark Carney noted that the ‘Fog of Brexit’ is creating tension and the British economy is not properly prepared for a No-Deal Brexit, which is looking increasingly likely with Brexit-day now just seven weeks away. This brought in an initial move of weakness that drove prices down towards that 1.2850 support. Mr. Carney did also note, however, later in his speech that clarity on Brexit could bring on the upside, which did appear to help soften the blow to a degree as buyers returned to push prices back above 1.2920.
In GBP/USD, prices remain above the 50% marker of the January bullish run, and RSI is in deep oversold territory, approaching the 20.0 value on the four-hour chart. But it may take a bit more than that to bring bulls back into the picture on a longer-term basis. For those looking at short-side strategies, resistance potential exists around that former area of support around the 1.3000 area, which currently syncs fairly-well with the bearish trend-line taken from swing-highs over the past week.
GBP/USD TWO-HOUR PRICE CHART
(Click on image to enlarge)
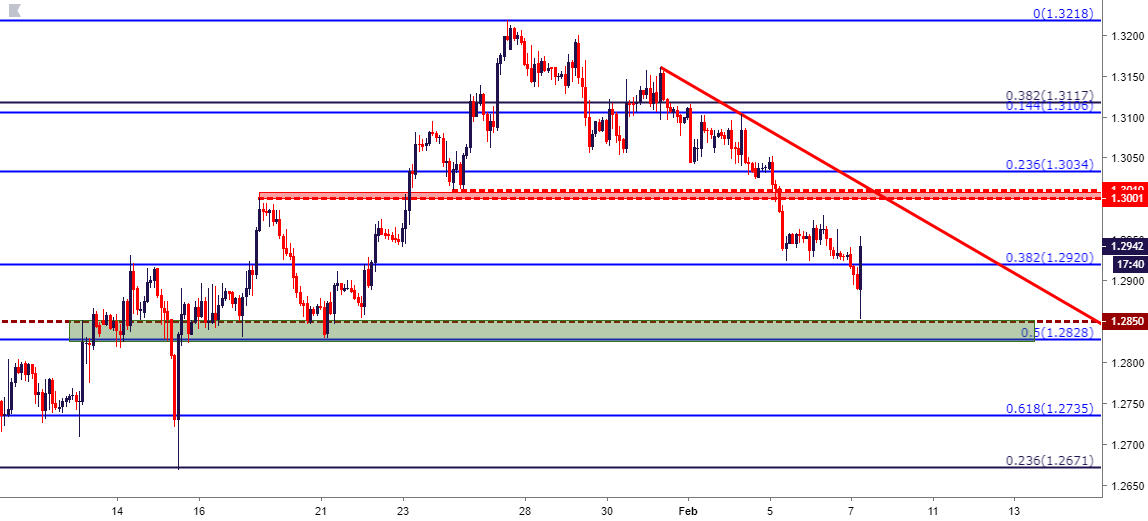
Chart prepared by James Stanley
EUR/USD BEARISH SHORT-TERM TREND CONTINUES
I had looked at this one in Tuesday’s webinar, remarking that the short-term trend that’s shown with prominence recently is in the midst of a longer-term range that’s now been in effect for more than three months. With prices making a fast approach towards longer-term support of that range, the big question is whether bears might have the motivation to finally break-through.
On the driver side, Italy has become a focal point again as yields are rising in response to a slowing economy and a less-optimistic outlook across both Italy and the Euro-Zone as a whole. The big question here is whether that’ll last long enough for bears to re-encounter deeper support within this longer-term range. Such potential exists around 1.1270 and 1.1215, which is the 18-month low in the pair.
EUR/USD DAILY PRICE CHART
(Click on image to enlarge)
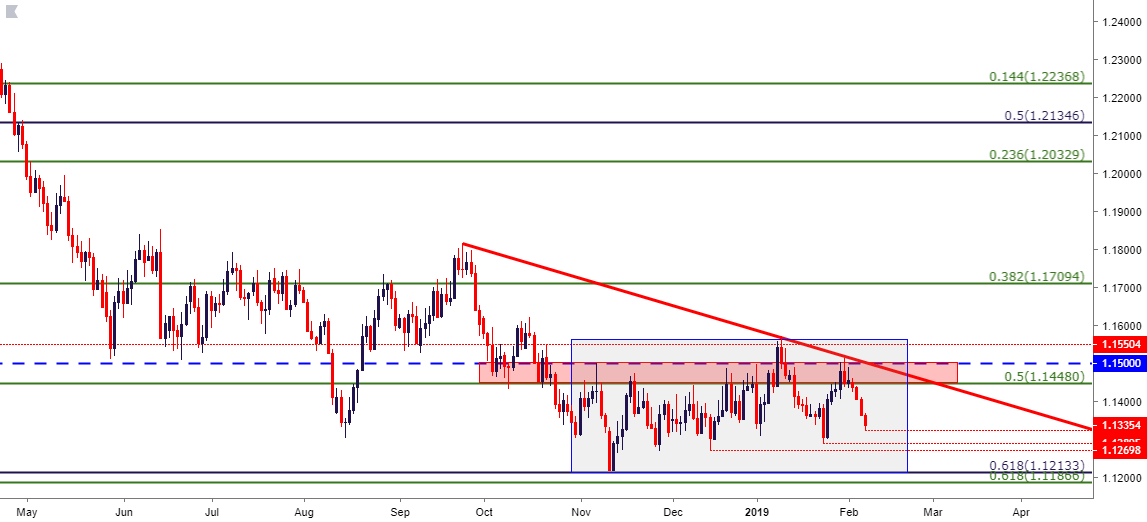
Chart prepared by James Stanley


Comments
Log in or sign up to join the conversation.