

GBP/USD
4 hour
(Click on image to enlarge)
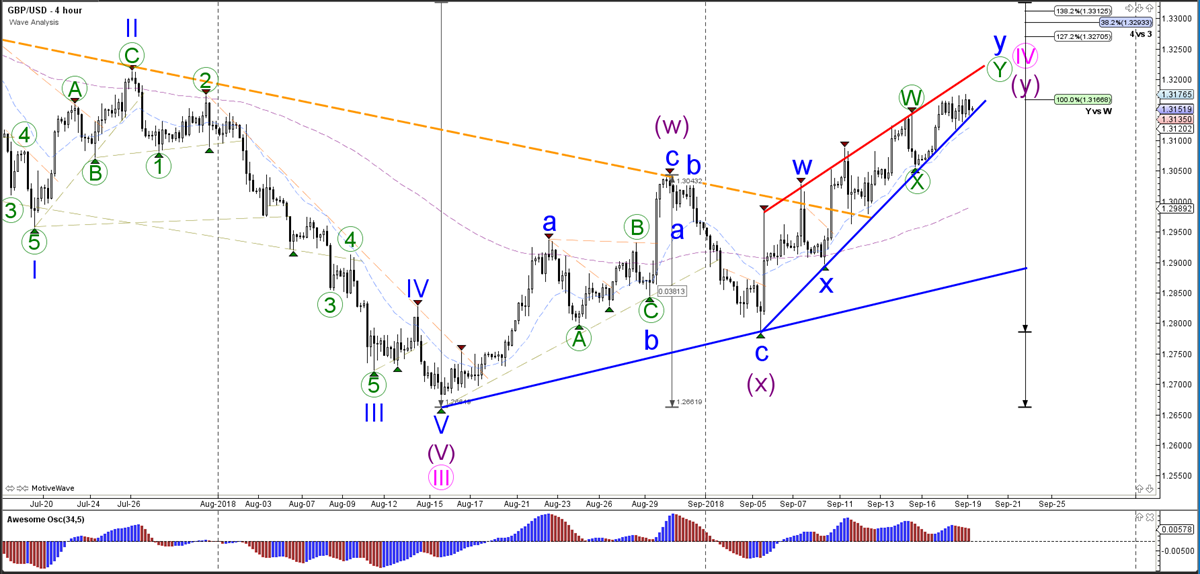
Source: Admiral Markets MT5 with MT5SE Add-on GBP/USD motive wave – 19 September 2018 at 4:00 AM GMT
The GBP/USD is unable to break or bounce at the 100% Fibonacci target of wave Y vs W. A bullish breakout could see the price move up higher towards the next cluster of Fibonacci levels, whereas a bearish bounce could break below the support trend line (blue) and a larger bearish correction.
1 hour
(Click on image to enlarge)

Source: Admiral Markets MT5 with MT5SE Add-on GBP/USD motive wave – 19 September 2018 at 4:00 AM GMT
The GBP/USD is moving sideways and is building a corrective zone. The price could be completing an ABC pattern (brown) within wave B (orange) as long as the price stays above the Fibonacci retracement levels of wave B vs A. A bearish break below the 100% Fibonacci level invalidates this wave pattern, whereas a bullish breakout could see a continuation towards 1.3250-1.33.



Comments
Log in or sign up to join the conversation.