
Fundamentals: Brexit Uucertainty & JPY demand as safe haven
Weekly Chart: Strongly bearish.
Daily Chart: Bearish but shifting bullish. Closing above 131.250 is near term trend change from bearish to neutral.
H4 Chart: Neutral shifting to bearish. H4 closing below 128.900 SMA100 is trend shift from neutral to bearish.
Hourly Chart: Bearish. The price is below all main MAs.
Intraday Key Levels:
Upside: 129.700 130.100 130.600
Downside: 128.900 128.200 127.800
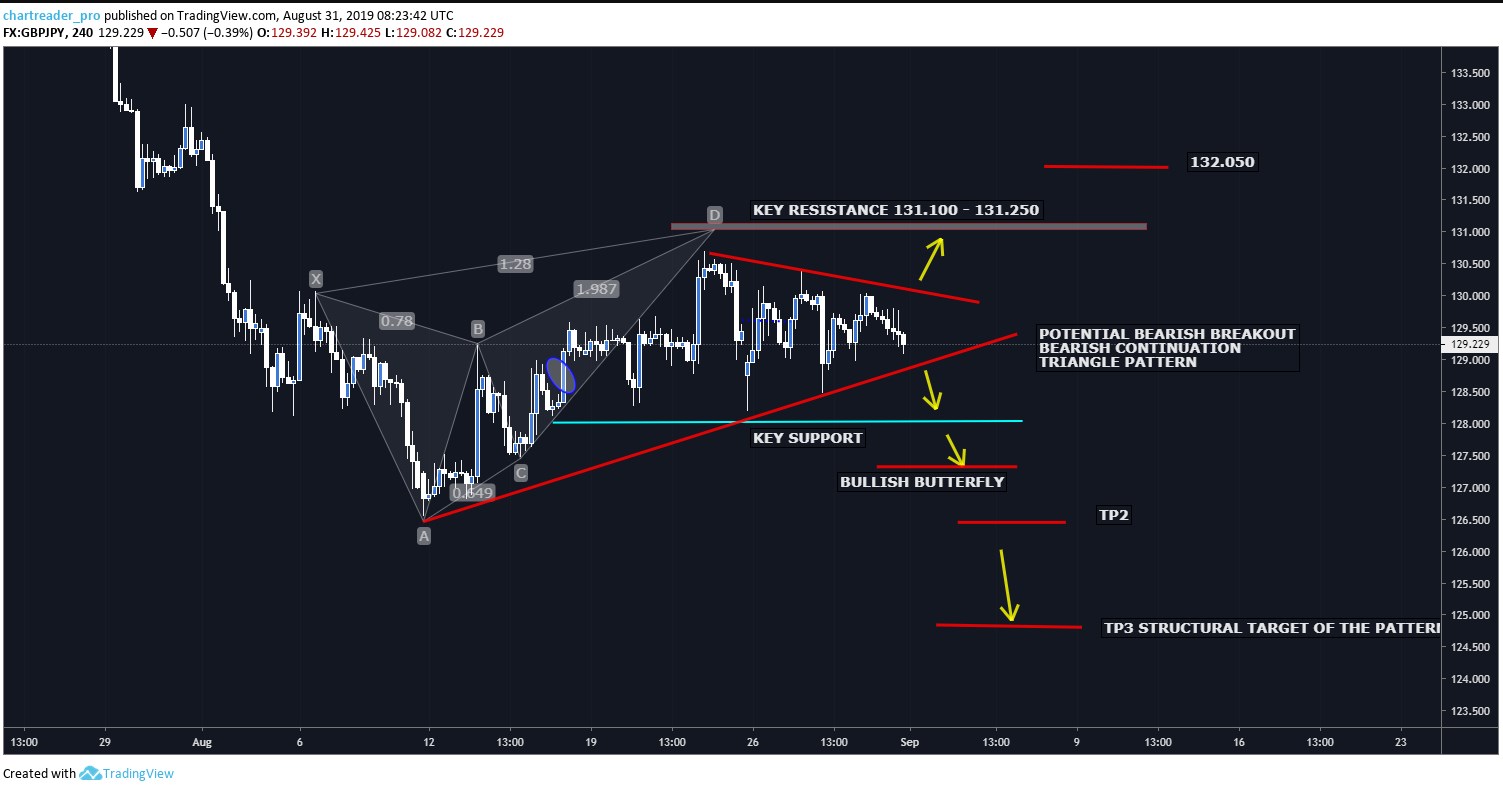
Chart Patterns:
Emerging Symmetrical Triangle Pattern H4 Chart
Emerging Bullish Butterfly Pattern H1 Chart
Our Comments: One of the most difficult instruments to trade. The nature of the pair is open to risks caused by volatility. We plan to sell/buy the breakout of the triangle pattern. Previous Bearish Butterfly pattern is still valid and Bearish pressure remains as long as it makes H4 closings below 131.250. The upside is capped by EMA50 Daily at 132.200.
Trade Opportunities: Short at 128.900 and buy the Bullish Butterfly on H1. Long at 129.600 and close at the Bearish Butterfly 1.27 extension.
Comments
Log in or sign up to join the conversation.